

The following data shows the release year of 1000 randomlyselected shows on Netflix (whose ratings include G,
Question:
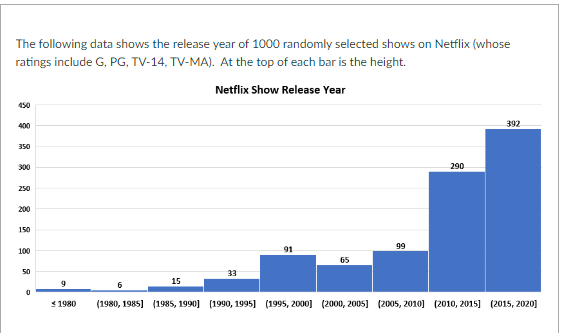
The following data shows the release year of 1000 randomlyselected shows on Netflix (whose ratings include G, PG, TV-14,TV-MA). At the top of each bar is the height.
[continuation of above question]
Is data is normally distributed? [ Select ] ["yes", "no"]
What is the shape of the distribution? [ Select ] ["skewed right", "skewed left","symmetrical but not normal", "symmetrical and normal"]
[continuation of above question]
If we knew the mean and standard deviation of the data, could weuse the empirical (69/95/99.7) rule to find the middle 95%?
Group of answer choices
Yes, we can always use that rule.
No, because the data does not follow a normal distribution.
[continuation of above question] If needed, round to 2decimal places.
How many shows were released before 1990?
What percent of shows were released before1990? %
This means 1990 is the rd percentile for releasedates.
Expert Answer:


Introduction to Corporate Finance What Companies Do
ISBN: 978-1111222284
3rd edition
Authors: John Graham, Scott Smart
