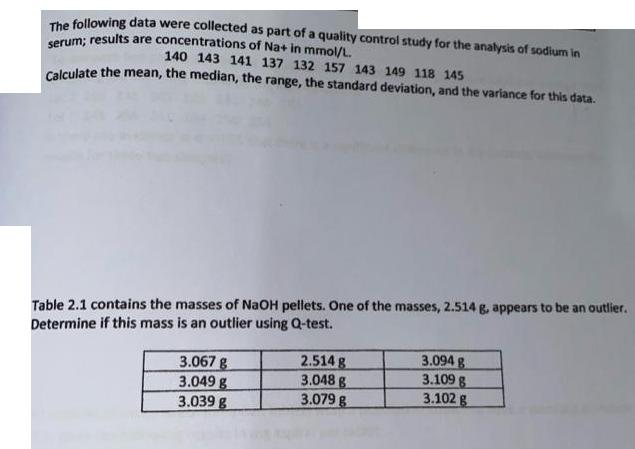
The following data were collected as part of a quality control study for the analysis of...
Fantastic news! We've Found the answer you've been seeking!
Question:
Transcribed Image Text:
The following data were collected as part of a quality control study for the analysis of sodium in serum; results are concentrations of Na+ in mmol/L. 140 143 141 137 132 157 143 149 118 145 Calculate the mean, the median, the range, the standard deviation, and the variance for this data. Table 2.1 contains the masses of NaOH pellets. One of the masses, 2.514 g, appears to be an outlier. Determine if this mass is an outlier using Q-test. 3.067 g 2.514 g 3.094 g 3.049 g 3.048 g 3.109 g 3.039 g 3.079 g 3.102 g 3. What is the 95% confidence interval for the amount of aspirin in a single analgesic tablet drawn from a population for which u is 250 mg and a2 is 25? 4. To compare two production lots of aspirin tablets, you collect samples from each and analyze them, obtaining the following results (in mg aspirin/tablet). Lot 1: 256 248 245 245 244 248 261 Lot 2: 241 258 241 244 256 254 Is there any evidence at a 0.05 that there is a significant difference in the variance between the results for these two samples? 5. An analysis of seven acetaminophen tablets from a population known to have a standard deviation of 5, gives the following results in mg aspirin per tablet: 246 249 255 251 251 247 250 What is the 95% confidence interval for the population's expected mean? 6. Suppose you are studying the distribution of zinc in a lake and want to know if there is a significant difference between the concentration of Zn at the sediment-water interface and its concentration at the air-water interface. You collect samples from six locations-near the lake's center, near its drainage outlet, etc.-obtaining the results (in mg/L) shown in the table. Using the data in the table shown below, determine if there is a significant difference between the concentration of Zn at the two interfaces at a -0.05. Location Air-Water Interface Sediment-Water Interface 1 0.430 0.415 2 0.266 0.238 3 0.457 0.390 4 0.531 0.410 5 0.707 0.605 6 0.716 0.609 Complete this analysis treating the data as (a) unpaired, and (b) paired. Briefly comment on your results. The following data were collected as part of a quality control study for the analysis of sodium in serum; results are concentrations of Na+ in mmol/L. 140 143 141 137 132 157 143 149 118 145 Calculate the mean, the median, the range, the standard deviation, and the variance for this data. Table 2.1 contains the masses of NaOH pellets. One of the masses, 2.514 g, appears to be an outlier. Determine if this mass is an outlier using Q-test. 3.067 g 2.514 g 3.094 g 3.049 g 3.048 g 3.109 g 3.039 g 3.079 g 3.102 g 3. What is the 95% confidence interval for the amount of aspirin in a single analgesic tablet drawn from a population for which u is 250 mg and a2 is 25? 4. To compare two production lots of aspirin tablets, you collect samples from each and analyze them, obtaining the following results (in mg aspirin/tablet). Lot 1: 256 248 245 245 244 248 261 Lot 2: 241 258 241 244 256 254 Is there any evidence at a 0.05 that there is a significant difference in the variance between the results for these two samples? 5. An analysis of seven acetaminophen tablets from a population known to have a standard deviation of 5, gives the following results in mg aspirin per tablet: 246 249 255 251 251 247 250 What is the 95% confidence interval for the population's expected mean? 6. Suppose you are studying the distribution of zinc in a lake and want to know if there is a significant difference between the concentration of Zn at the sediment-water interface and its concentration at the air-water interface. You collect samples from six locations-near the lake's center, near its drainage outlet, etc.-obtaining the results (in mg/L) shown in the table. Using the data in the table shown below, determine if there is a significant difference between the concentration of Zn at the two interfaces at a -0.05. Location Air-Water Interface Sediment-Water Interface 1 0.430 0.415 2 0.266 0.238 3 0.457 0.390 4 0.531 0.410 5 0.707 0.605 6 0.716 0.609 Complete this analysis treating the data as (a) unpaired, and (b) paired. Briefly comment on your results.
Expert Answer:
Answer rating: 100% (QA)
1To calculate the mean median range standard deviation and variance for the given data set we first need to organize the data in ascending order 118 132 137 141 143 143 145 149 157 1 Mean Mean Sum of ... View the full answer
Related Book For
Introduction To Mathematical Statistics And Its Applications
ISBN: 9780321693945
5th Edition
Authors: Richard J. Larsen, Morris L. Marx
Posted Date:
Students also viewed these mathematics questions
-
The following data were collected as part of a study to see whether a mouses early upbringing has any effect on its aggressiveness later in life (84). A total of 307 mice were divided into two groups...
-
The data in Table P-14 were collected as part of a study of real estate property evaluation. The numbers are observations on X = assessed value (in thousands of dollars) on the city assessor's books...
-
If the central-limit theorem holds, what proportion of the sample means should fall within 0.5 lb of the population mean (112.0 oz)? Obstetrics Figure 6.4b (p. 172) plotted the sampling distribution...
-
Our thoughts return to Ambrose and his nuts and berries. Ambroses utility function is U(x1, x2) = 4x1 + x2, where x1 is his consumption of nuts and x2 is his consumption of berries. (a) Let us find...
-
Analyzing a Portfolio you have $100,000 to invest in a portfolio containing Stock X, Stock Y, and a risk-free asset. You must invest all of your money. Your goal is to create a portfolio that has an...
-
How wide does a single slit have to be so that \(684-\mathrm{nm}\) light passing through the slit has its first dark fringe \(20.0^{\circ}\) from the center of the interference pattern?
-
Under the assumptions of the linear model, the values of y|x follow a _______________ . In Exercises 7 and 8, fill in each blank with the appropriate word or phrase.
-
The initial proceeds per bond, the size of the issue, the initial maturity of the bond, and the years remaining to maturity are shown in the following table for a number of bonds. In each case the...
-
Using the worksheet on the below conduct a Before Tax/ No Financing Analysis for a 100 unit property and answer the following questions given the following information: Sales Price should be...
-
The following table shows the cost of tuition at Jensen University for the years 2002-2016. Year, t Cost ($), C 2002 2004 C. 2006 2008 5000 5250 5450 5750 2010 a. Explain why the cost of tuition not...
-
Jasmine Wang owns and operates a small chocolate factory, Rhapsody Chocolates, and sells the chocolates she makes to chocolate speciality shops and online customers. While watching the recent All...
-
Costco Wholesale Corporation (COST) and Walmart Stores Inc. (WMT) reported the following data (in millions) for a recent year: Sales Operating income Average total assets Average stockholders' equity...
-
A box is on a frictionless horizontal surface. Two ropes pull on the box horizontally in opposite directions. The box is moving to the right and slowing down. A proposed free body diagram of the box...
-
What strategies can urban planners adopt to manage the complexities of mixed-use development, transportation networks, and zoning regulations in rapidly growing cities?
-
How does urbanization contribute to the acceleration of climate change, and what adaptive measures can cities implement to enhance resilience against climate-related risks ?
-
Teecorp Company provides the following ABC costing information: Activities Total Costs Activity-cost drivers Labor $320,000 8,000 hours Gas $36,000 6,000 gallons Invoices $40,000 2,500 invoices Total...
-
With the information below, complete the table. Report Date Currency Audit Status Consolidated Scale Interest Income Earnings Before Tax Taxation report Date Currency Audit Status Consolidated...
-
-4 1 9. Let A = Find A-1, (A") and verify that (A")= (A-1)".
-
Records kept at an eastern racetrack showed the following distribution of winners as a function of their starting-post position. All 144 races were run with a full field of eight horses. Test an...
-
According to a family-oriented lobbying group, there is too much crude language and violence on television. Forty-two percent of the programs they screened had language they found offensive, 27% were...
-
If X and Y have the joint pdf fX,Y(x, y) =2, 0 x < y 1 find P(0 < X < 1/2|Y = 3/4).
-
The circuit in Figure 8.31 is to be designed such that the quiescent collector currents are \(4 \mathrm{~mA}\left(v_{O}=0 ight)\). Assume \(I_{S Q}=2 \times 10^{-15} \mathrm{~A}\) and \(I_{S D}=\)...
-
The value of \(I_{\text {Bias }}\) in the circuit shown in Figure 8.31 is \(0.5 \mathrm{~mA}\). Assume diode and transistor parameters of \(I_{S D 1}=10^{-16} \mathrm{~A}, I_{S D 2}=4 \times 10^{-16}...
-
Using the parameters given in Example 8.11 for the circuit in Figure 8.34, calculate the input resistance when the quiescent output voltage is zero. iB1 www R JiEI 23 R3 iB2 R4 Q2 iE2 Q4 ww R 150 ww...
Study smarter with the SolutionInn App