

Question: The following describes a data set but does not give actual data. For the data set, describe the data as qualitative or quantitative, and then
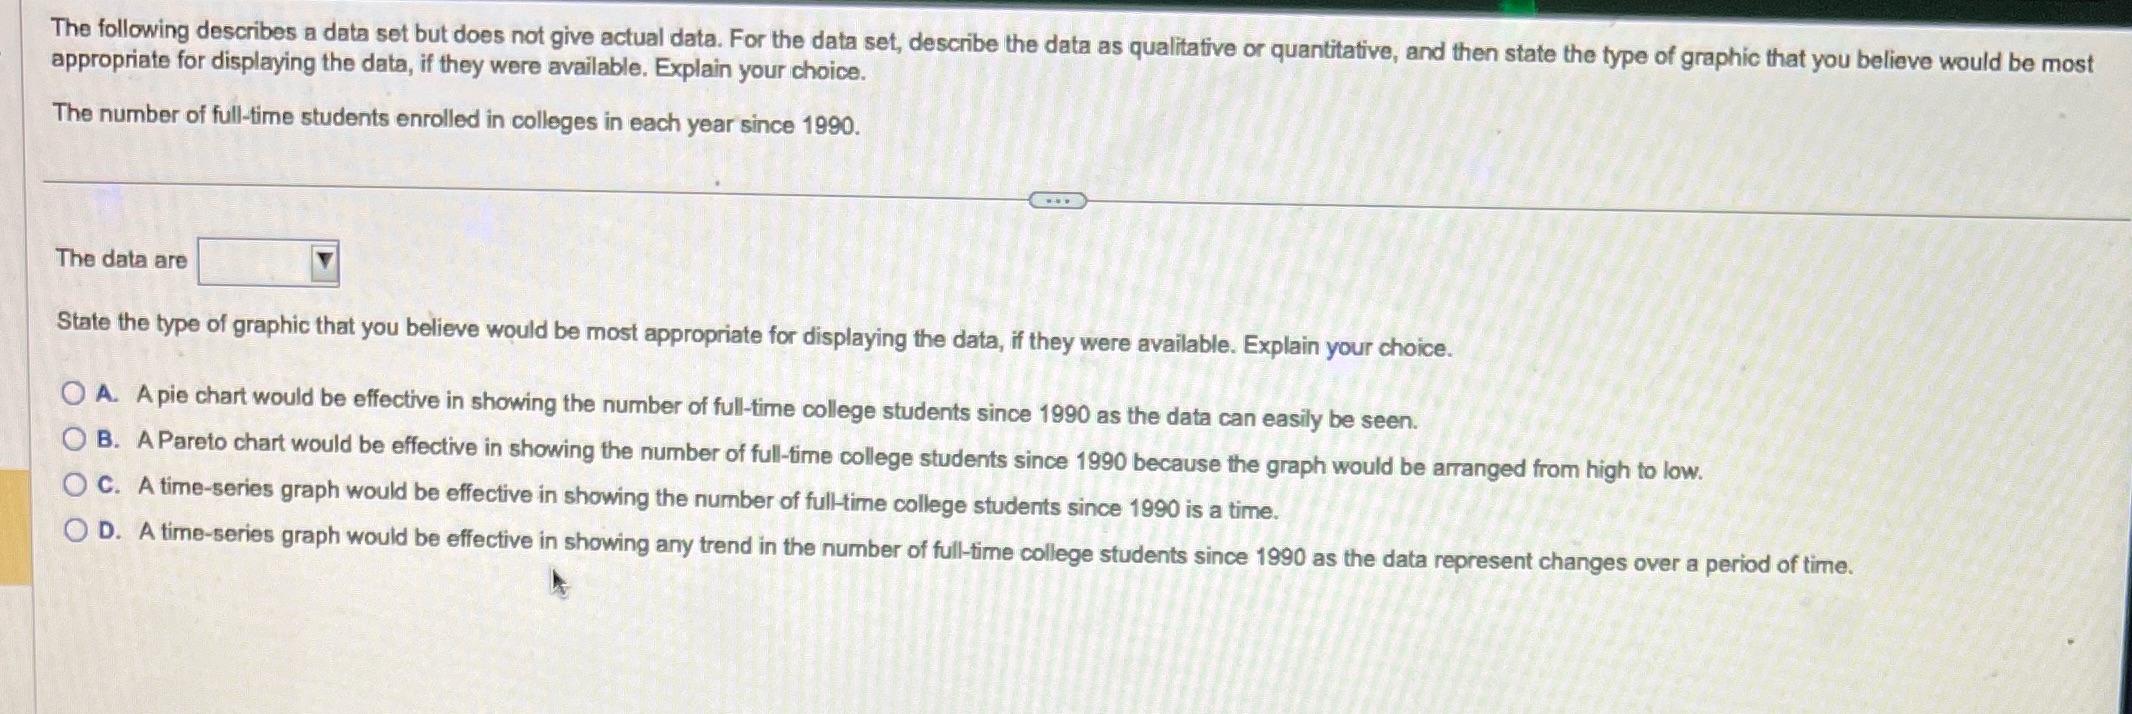
The following describes a data set but does not give actual data. For the data set, describe the data as qualitative or quantitative, and then state the type of graphic that you believe would be most appropriate for displaying the data, if they were available. Explain your choice. The number of full-time students enrolled in colleges in each year since 1990. The data are State the type of graphic that you believe would be most appropriate for displaying the data, if they were available. Explain your choice. A. A pie chart would be effective in showing the number of full-time college students since 1990 as the data can easily be seen. B. A Pareto chart would be effective in showing the number of full-time college students since 1990 because the graph would be arranged from high to low. O C. A time-series graph would be effective in showing the number of full-time college students since 1990 is a time. O D. A time-series graph would be effective in showing any trend in the number of full-time college students since 1990 as the data represent changes over a period of time
Step by Step Solution
There are 3 Steps involved in it

Get step-by-step solutions from verified subject matter experts