

Question: The following diagram shows a 4 - step process that begins with Operation 1 and ends with Operation 4 . The rates shown in each
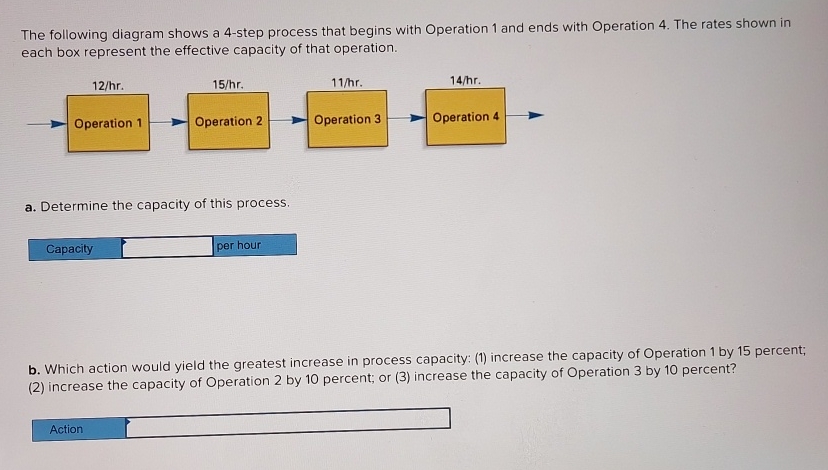
The following diagram shows a step process that begins with Operation and ends with Operation The rates shown in each box represent the effective capacity of that operation.
a Determine the capacity of this process.
Capacity
per hour
b Which action would yield the greatest increase in process capacity: increase the capacity of Operation by percent;
increase the capacity of Operation by percent; or increase the capacity of Operation by percent?
Step by Step Solution
There are 3 Steps involved in it
1 Expert Approved Answer
Step: 1 Unlock

Question Has Been Solved by an Expert!
Get step-by-step solutions from verified subject matter experts
Step: 2 Unlock
Step: 3 Unlock