

Question: The following DO measurements were made for three different streams in a watershed. Readings were taken at midnight and then every two hours for
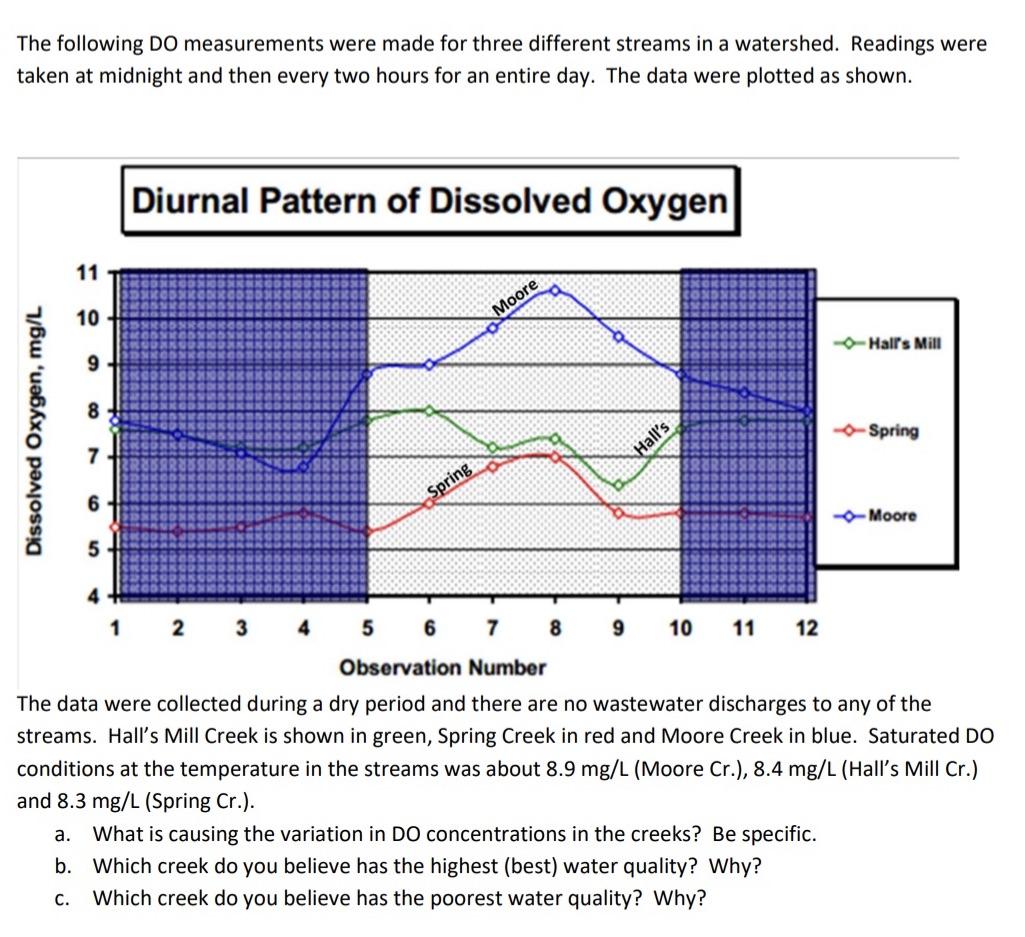
The following DO measurements were made for three different streams in a watershed. Readings were taken at midnight and then every two hours for an entire day. The data were plotted as shown. Dissolved Oxygen, mg/L 11 10 Diurnal Pattern of Dissolved Oxygen 1 2 3 4 Spring 5 Moore 6 7 Observation Number The data were collected during a dry period and there are no wastewater discharges to any of the streams. Hall's Mill Creek is shown in green, Spring Creek in red and Moore Creek in blue. Saturated DO conditions at the temperature in the streams was about 8.9 mg/L (Moore Cr.), 8.4 mg/L (Hall's Mill Cr.) and 8.3 mg/L (Spring Cr.). 8 Hall's 9 10 11 12 --Hall's Mill a. What is causing the variation in DO concentrations in the creeks? Be specific. b. Which creek do you believe has the highest (best) water quality? Why? C. Which creek do you believe has the poorest water quality? Why? --Spring Moore
Step by Step Solution
There are 3 Steps involved in it
a The variation in DO concentrations in the creeks is likely due to differences in factors such as t... View full answer

Get step-by-step solutions from verified subject matter experts