The following figure plots the US unemployment rate (blue), the US government spending to GDP ratio (red),
Question:
The following figure plots the US unemployment rate (blue), the US government spending to GDP ratio (red), and the US Federal Funds interest rate (green) between 1980 and 2018. The shaded areas represent the recession dates.
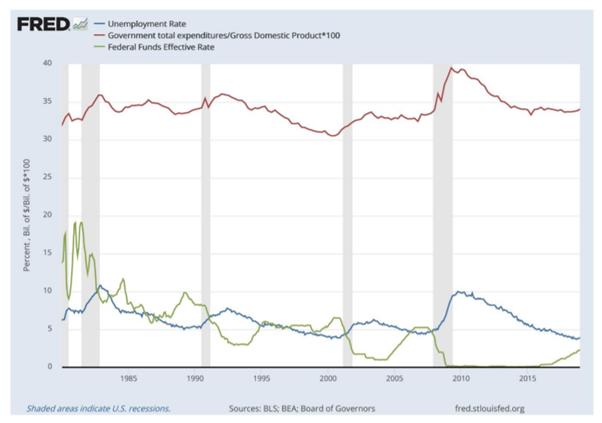
Based on the figure, discuss: a) [15 marks] How does the monetary policy react to negative shocks in the economy? Explain the main transition mechanisms of monetary policy and describe a model with which you can study these mechanisms. Illustrate on an appropriate diagram.
b) [10 marks] Discuss potential problems of implementing monetary policy that you can see on the figure above. How did the central banks in different countries go around such problems?
c) [15 marks] How does the fiscal policy react to negative shocks in the economy? Explain the difference between automatic and discretionary changes and how they differ in the models studied in class. Can you distinguish the two on the diagram?
d) [10 marks] Discuss how a lack of coordination between monetary and fiscal policy can decrease the efficiency of fiscal policy. Illustrate the mechanism on an appropriate diagram.
Expert Answer:
a Monetary Policy Response to Negative Economic Shocks Monetary policyimplemented by central banksaims to maintain price stability and promote economic growthIn response to negative shockssuch as rece... View the full answer