

The following figure represents two oxygen-dissociation curves of Hb passing through a human cardiovascular system. Which curve
Fantastic news! We've Found the answer you've been seeking!
Question:
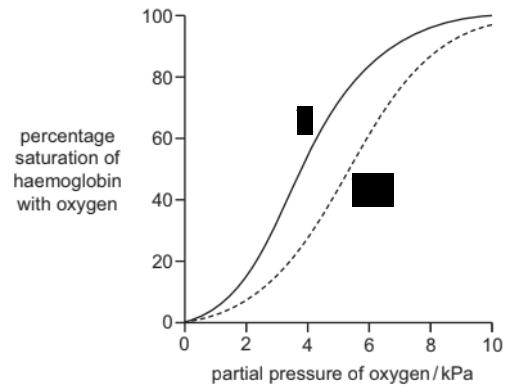
The following figure represents two oxygen-dissociation curves of Hb passing through a human cardiovascular system. Which curve represents a group of Hb tetramers closer to metabolically active tissues? Top black rectangle is Y. Bottom black rectangle is X.
A. X
B. Y
C. Impossible to tell
D. Other, explain. __________
Expert Answer:

Related Book For 

Posted Date:
