

Question: The following figure shows a randomization distribution for the hypotheses Ho versus H The statistic used for each sample is D 1 2 Which of
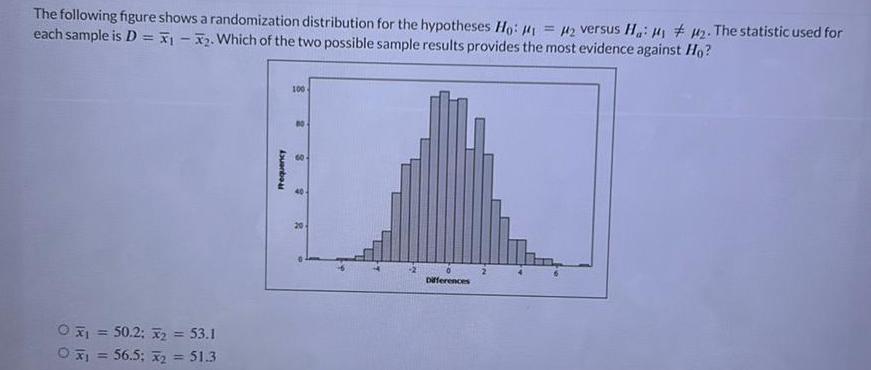

The following figure shows a randomization distribution for the hypotheses Ho versus H The statistic used for each sample is D 1 2 Which of the two possible sample results provides the most evidence against Ho Ox 50 2 x 53 1 Ox1 56 5 Xx2 51 3 Frequency 100 2 60 40 20 Differences
Step by Step Solution
There are 3 Steps involved in it
1 Expert Approved Answer
Step: 1 Unlock

Question Has Been Solved by an Expert!
Get step-by-step solutions from verified subject matter experts
Step: 2 Unlock
Step: 3 Unlock