

Question: The following fixed operating cost schedule is provided: Cost Category amount Administration and management 480,000 Accounting support 27,000 Marketing 53,000 IT support 70,000 Office equipment
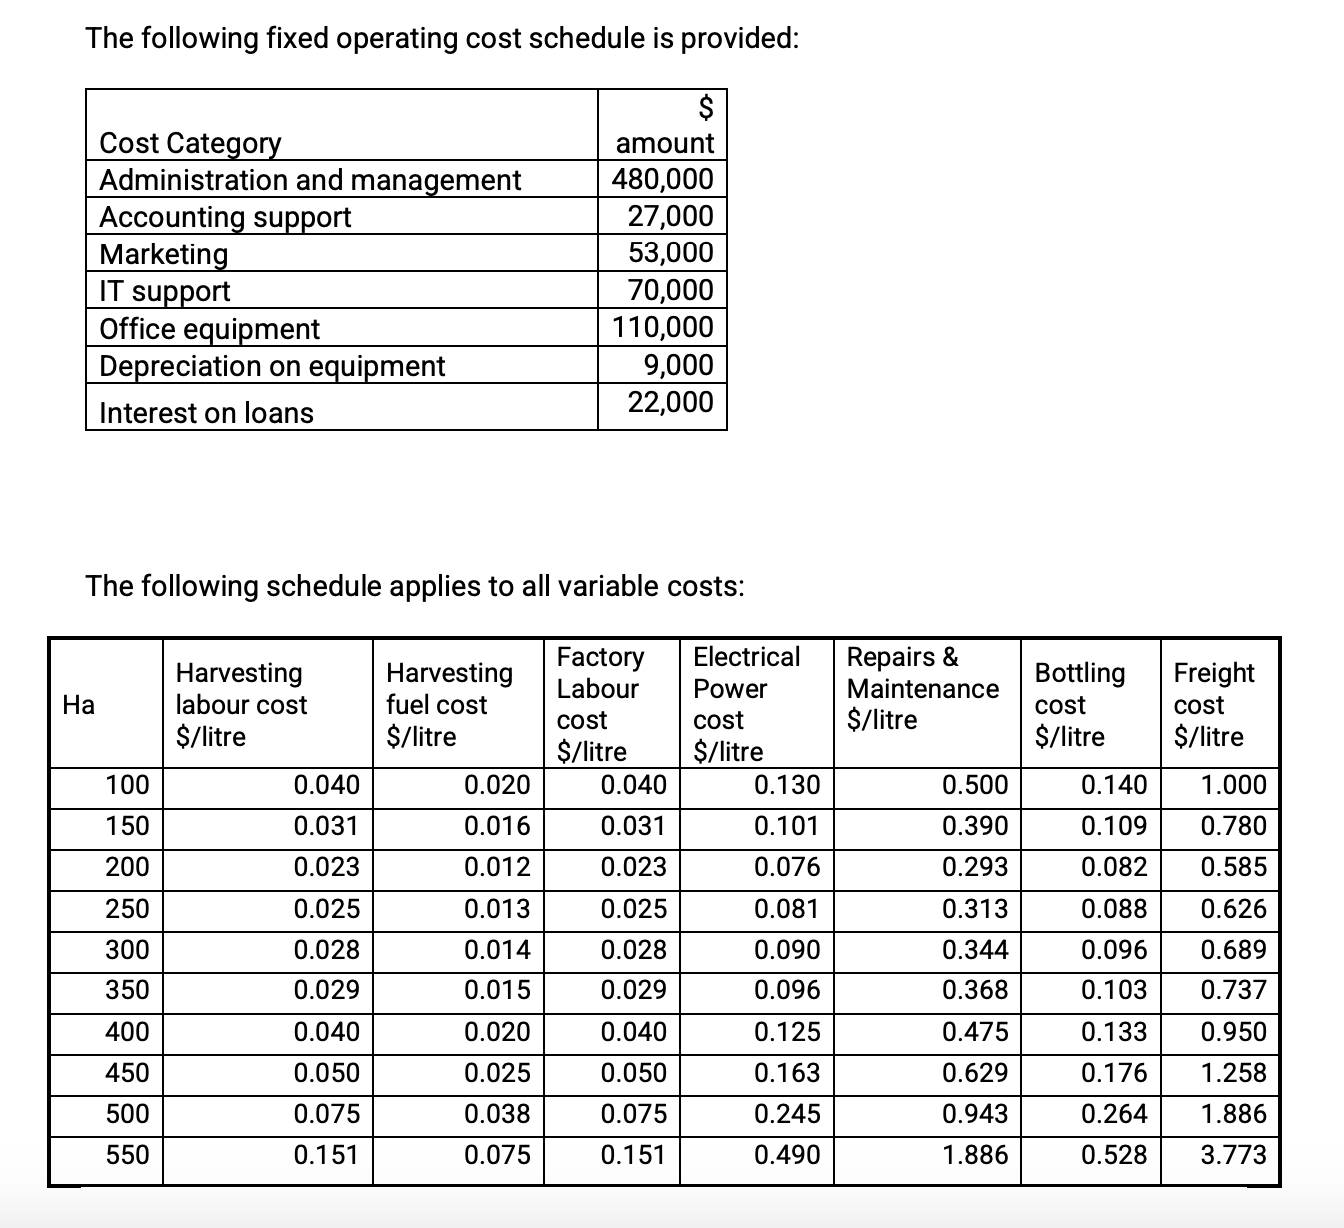
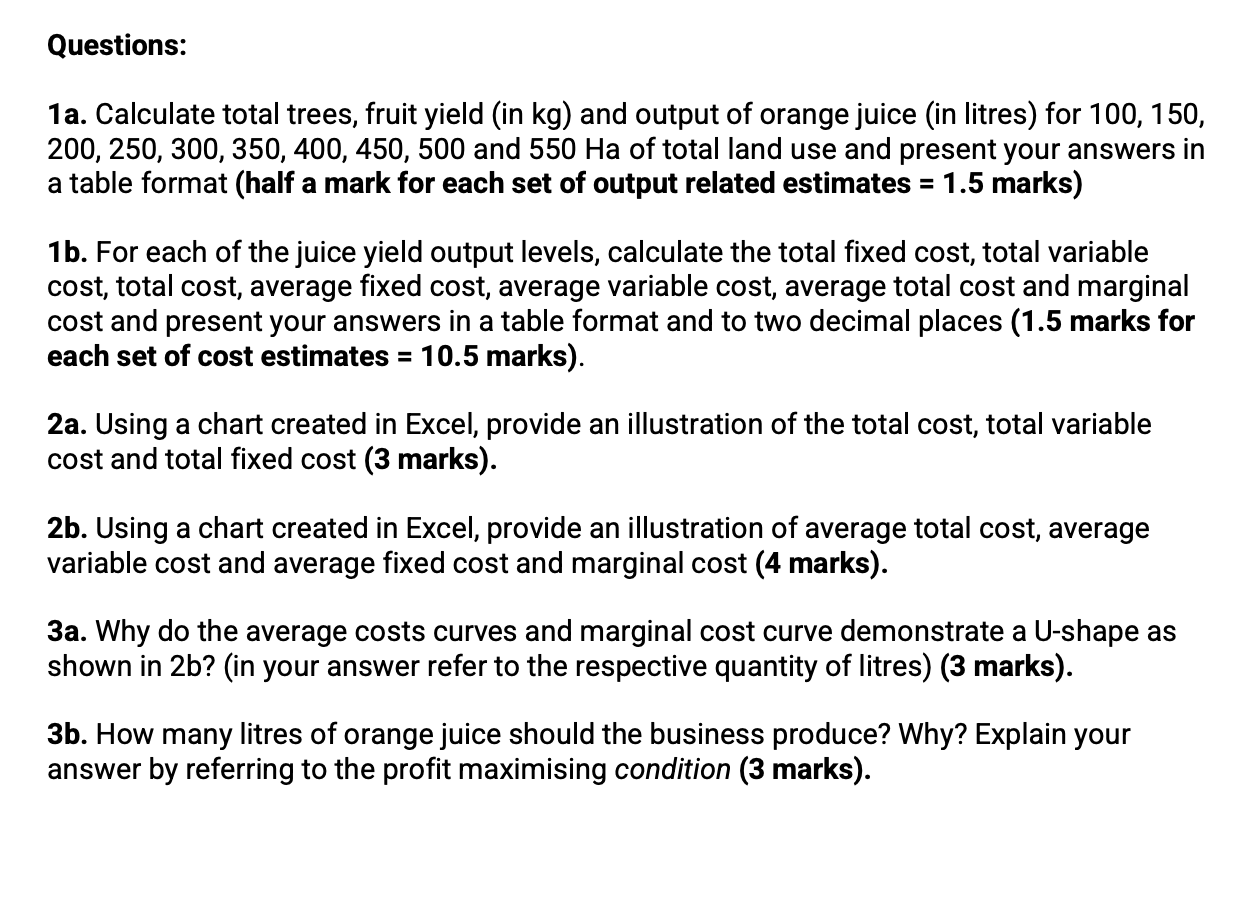
The following fixed operating cost schedule is provided: Cost Category amount Administration and management 480,000 Accounting support 27,000 Marketing 53,000 IT support 70,000 Office equipment 110,000 Depreciation on equipment 9,000 Interest on loans 22,000 The following schedule applies to all variable costs: Harvesting Harvesting Factory Electrical Repairs & Power Bottling Freight Ha labour cost fuel cost Labour Maintenance cost cost $/litre $/litre cost cost $/litre $/litre $/litre $/litre $/litre 100 0.040 0.020 0.040 0.130 0.500 0.140 1.000 150 0.031 0.016 0.031 0.101 0.390 0.109 0.780 200 0.023 0.012 0.023 0.076 0.293 0.082 0.585 250 0.025 0.013 0.025 0.081 0.313 0.088 0.626 300 0.028 0.014 0.028 0.090 0.344 0.096 0.689 350 0.029 0.015 0.029 0.096 0.368 0.103 0.737 400 0.040 0.020 0.040 0.125 0.475 0.133 0.950 450 0.050 0.025 0.050 0.163 0.629 0.176 1.258 500 0.075 0.038 0.075 0.245 0.943 0.264 1.886 550 0.151 0.075 0.151 0.490 1.886 0.528 3.773Questions: 1a. Calculate total trees, fruit yield (in kg) and output of orange juice (in litres) for 100, 150, 200, 250, 300, 350, 400, 450, 500 and 550 Ha of total land use and present your answers in a table format (half a mark for each set of output related estimates = 1.5 marks) 1b. For each of the juice yield output levels, calculate the total fixed cost, total variable cost, total cost, average fixed cost, average variable cost, average total cost and marginal cost and present your answers in a table format and to two decimal places (1.5 marks for each set of cost estimates = 1 0.5 marks). 2a. Using a chart created in Excel, provide an illustration of the total cost, total variable cost and total fixed cost (3 marks). 2b. Using a chart created in Excel, provide an illustration of average total cost, average variable cost and average fixed cost and marginal cost (4 marks). 3a. Why do the average costs curves and marginal cost curve demonstrate a Ushape as shown in 2b? (in your answer refer to the respective quantity of litres) (3 marks). 3b. How many litres of orange juice should the business produce? Why? Explain your answer by referring to the profit maximising condition
Step by Step Solution
There are 3 Steps involved in it

Get step-by-step solutions from verified subject matter experts