

Question: The following graph depicts the area between the x axis and a functions curve You can zoom in and out using the scroll on the
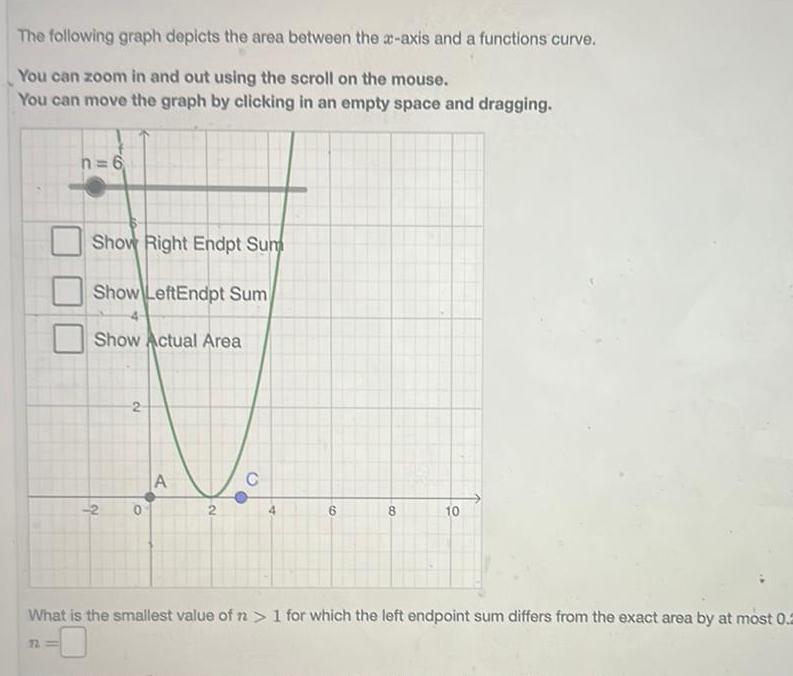

The following graph depicts the area between the x axis and a functions curve You can zoom in and out using the scroll on the mouse You can move the graph by clicking in an empty space and dragging n 6 12 Show Right Endpt Sum Show LeftEndpt Sum Show Actual Area 2 19 O A 2 C 6 8 10 What is the smallest value of n 1 for which the left endpoint sum differs from the exact area by at most 0 2
Step by Step Solution
There are 3 Steps involved in it
1 Expert Approved Answer
Step: 1 Unlock

Question Has Been Solved by an Expert!
Get step-by-step solutions from verified subject matter experts
Step: 2 Unlock
Step: 3 Unlock