

Question: The following graph illustrates Multiple Choice a distribution for a single variable a positive or direct relationship a negative or inverse relationship no relationship
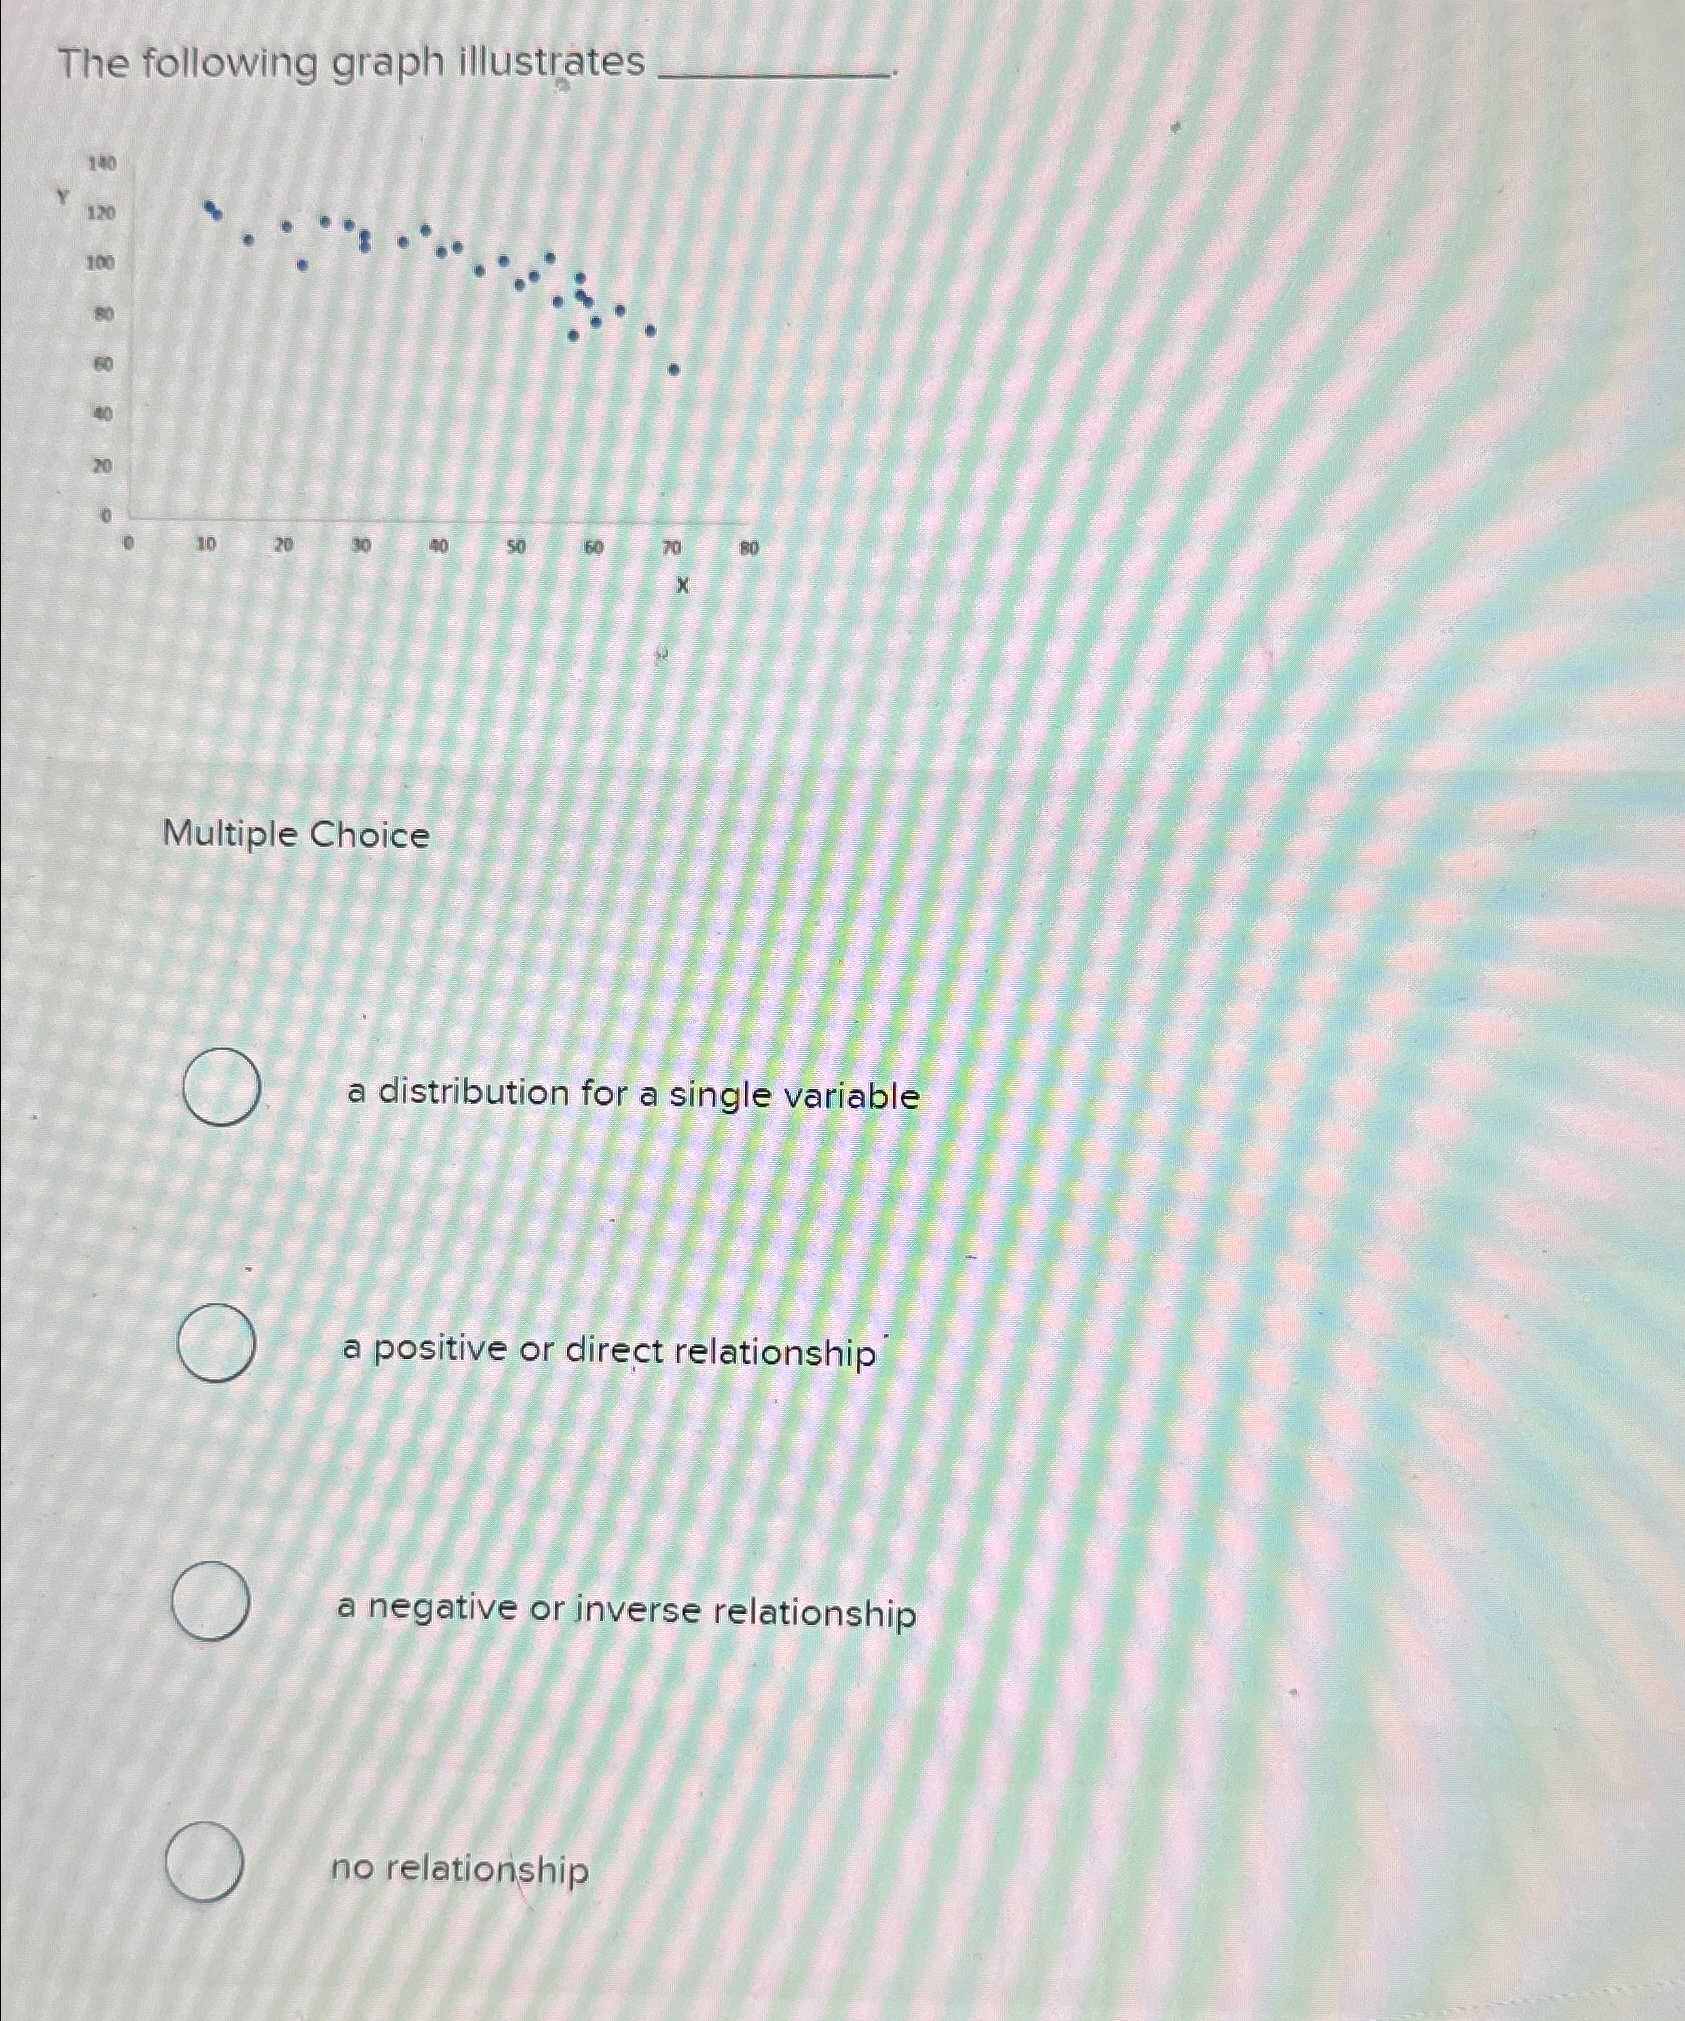
The following graph illustrates
Multiple Choice
a distribution for a single variable
a positive or direct relationship
a negative or inverse relationship
no relationship
Step by Step Solution
There are 3 Steps involved in it
1 Expert Approved Answer
Step: 1 Unlock

Question Has Been Solved by an Expert!
Get step-by-step solutions from verified subject matter experts
Step: 2 Unlock
Step: 3 Unlock