

Question: The following graph is a scatterplot of the Rateprof dataset from the alr4 library we used in the lecture. We want to use the clarity
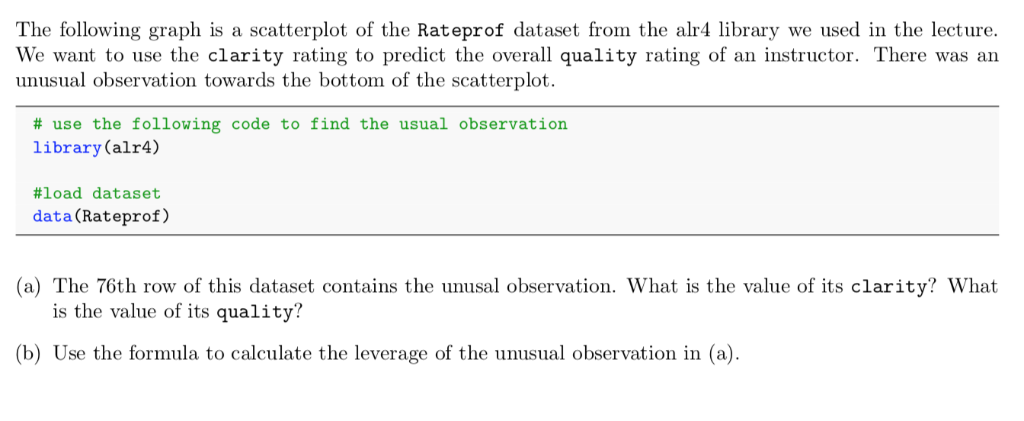
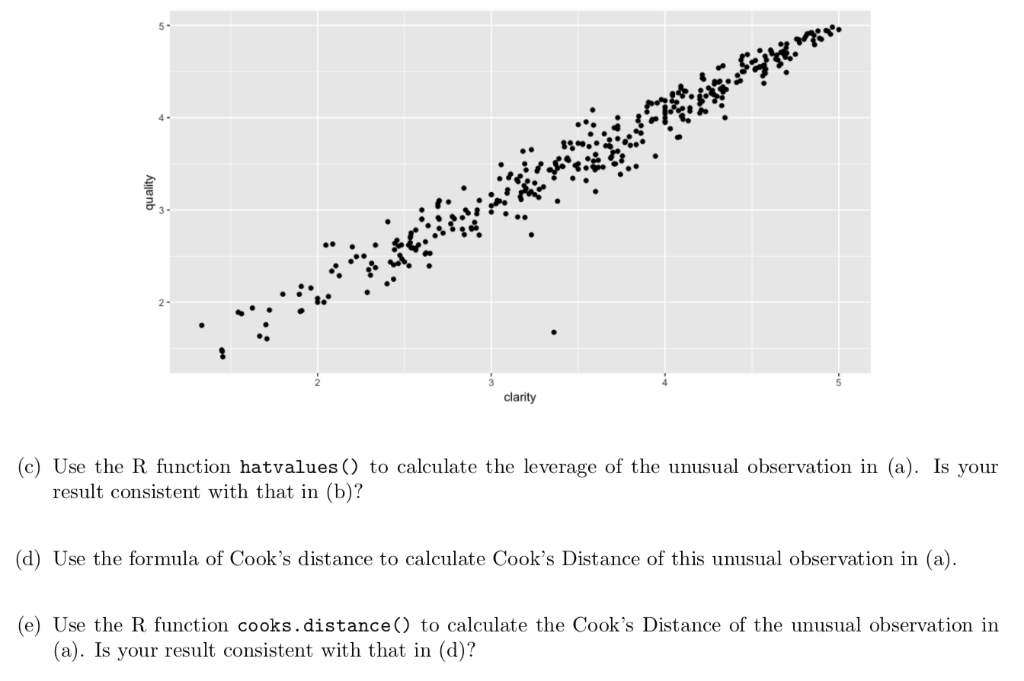
The following graph is a scatterplot of the Rateprof dataset from the alr4 library we used in the lecture. We want to use the clarity rating to predict the overall quality rating of an instructor. There was an unusual observation towards the bottom of the scatterplot # use the following code to find the usual observation library (alr4) #load dataset data (Rateprof) (a) The 76th row of this dataset contains the unusal observation. What is the value of its clarity? What is the value of its quality? (b) Use the formula to calculate the leverage of the unusual observation in (a). clarity (c) Use the R function hatvalues ) to calculate the leverage of the unusual observation in (a). Is your result consistent with that in (b? (d) Use the formula of Cook's distance to calculate Cook's Distance of this unusual observation in (a) (e) Use the R function cooks.distance) to calculate the Cook's Distance of the unusual observation in (a). Is your result consistent with that in (d)? The following graph is a scatterplot of the Rateprof dataset from the alr4 library we used in the lecture. We want to use the clarity rating to predict the overall quality rating of an instructor. There was an unusual observation towards the bottom of the scatterplot # use the following code to find the usual observation library (alr4) #load dataset data (Rateprof) (a) The 76th row of this dataset contains the unusal observation. What is the value of its clarity? What is the value of its quality? (b) Use the formula to calculate the leverage of the unusual observation in (a). clarity (c) Use the R function hatvalues ) to calculate the leverage of the unusual observation in (a). Is your result consistent with that in (b? (d) Use the formula of Cook's distance to calculate Cook's Distance of this unusual observation in (a) (e) Use the R function cooks.distance) to calculate the Cook's Distance of the unusual observation in (a). Is your result consistent with that in (d)
Step by Step Solution
There are 3 Steps involved in it

Get step-by-step solutions from verified subject matter experts