

Question: The following graph shows a decrease in short - run aggregate supply ( AS ) in a hypothetical economy where the currency is the dollar.
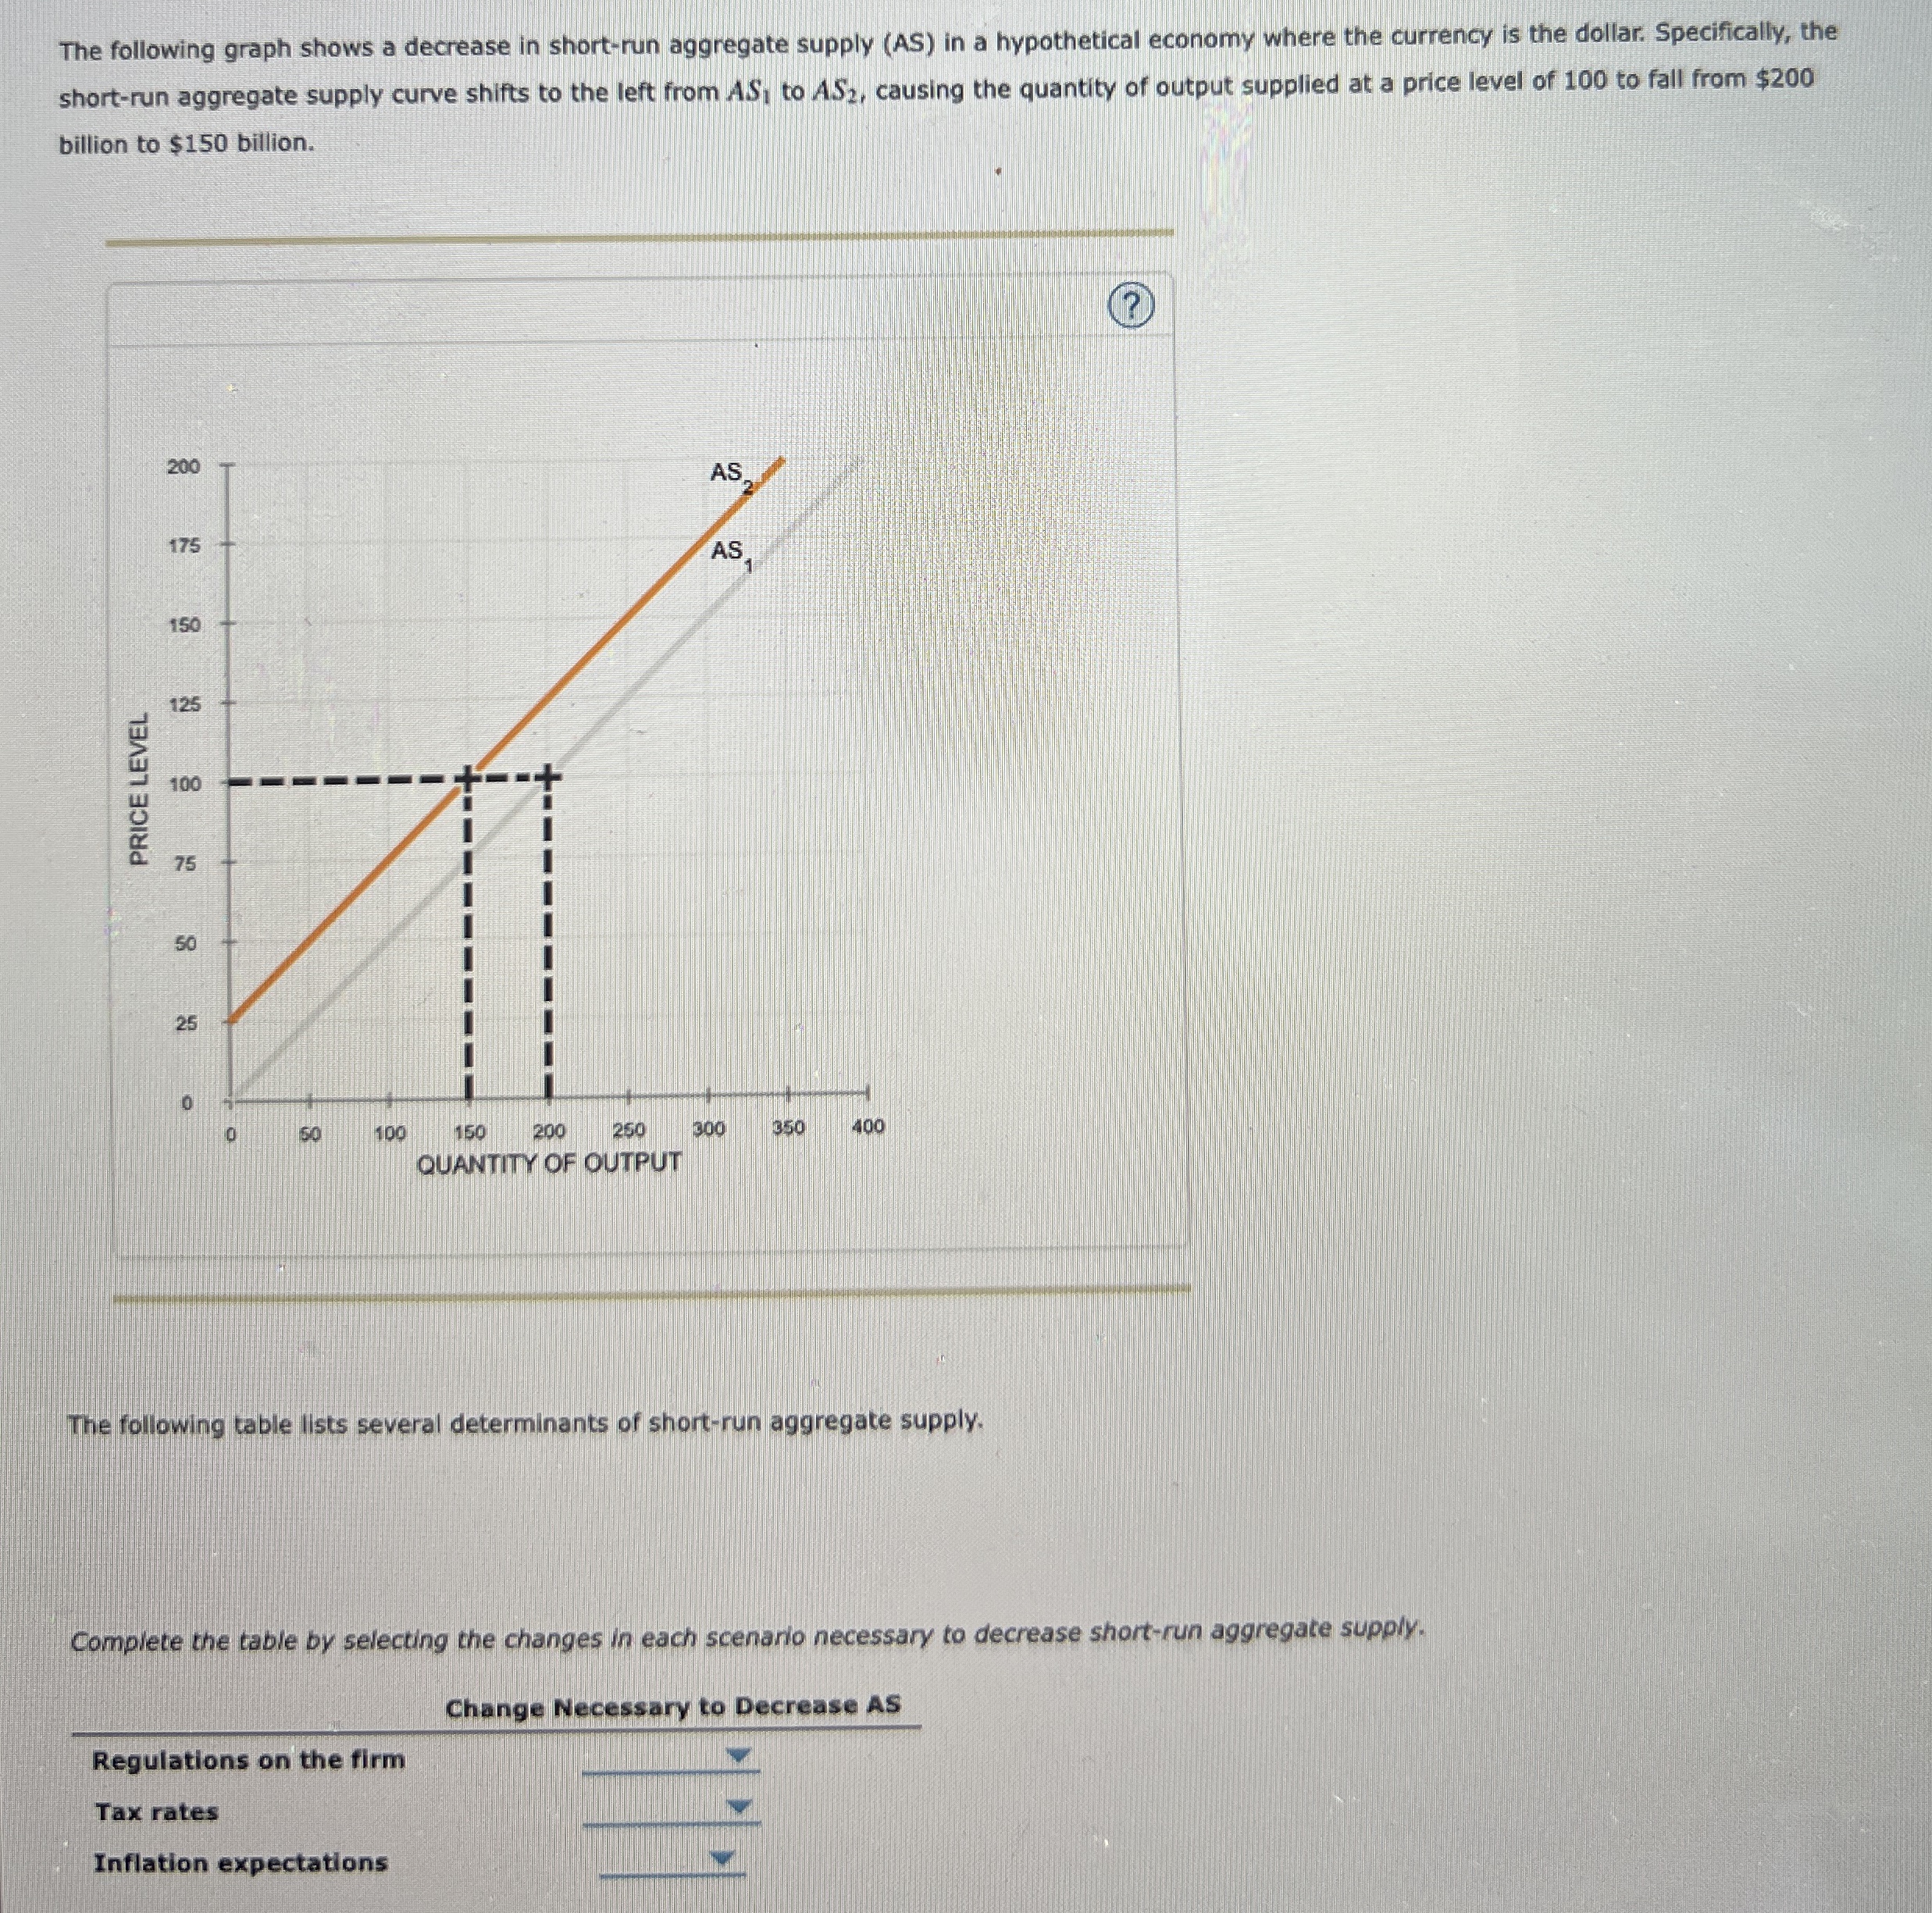
The following graph shows a decrease in shortrun aggregate supply AS in a hypothetical economy where the currency is the dollar. Specifically, the shortrun aggregate supply curve shifts to the left from to causing the quantity of output supplied at a price level of to fall from $ billion to $ billion.
The following table lists several determinants of shortrun aggregate supply.
Complete the table by selecting the changes in each scenario necessary to decrease shortrun aggregate supply.
Change Necessary to Decrease AS
Regulations on the firm
Tax rates
Inflation expectations
Step by Step Solution
There are 3 Steps involved in it
1 Expert Approved Answer
Step: 1 Unlock

Question Has Been Solved by an Expert!
Get step-by-step solutions from verified subject matter experts
Step: 2 Unlock
Step: 3 Unlock