

Question: The following graph shows aggregate demand and short-run aggregate supply. 1.) Use the line drawing tool to show the effect of an unexpected increase
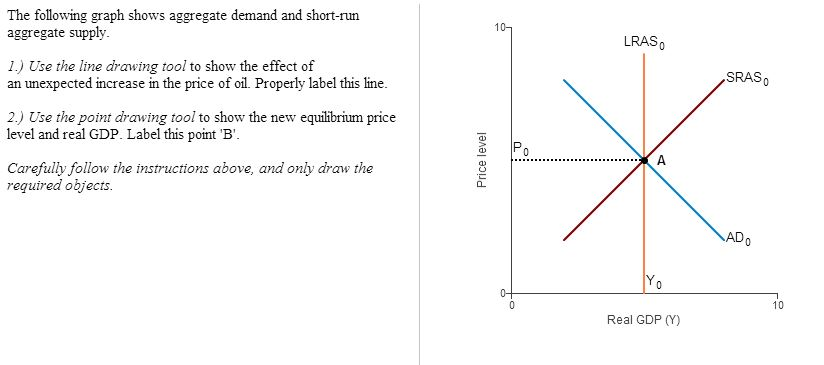
The following graph shows aggregate demand and short-run aggregate supply. 1.) Use the line drawing tool to show the effect of an unexpected increase in the price of oil. Properly label this line. 2.) Use the point drawing tool to show the new equilibrium price level and real GDP. Label this point 'B'. Carefully follow the instructions above, and only draw the required objects. Price level 10 Q 0 LRASO SRAS * A ADO Yo Real GDP (Y) 10
Step by Step Solution
3.58 Rating (155 Votes )
There are 3 Steps involved in it
1 An unexpected decrease in the oil price will increase the aggregate ... View full answer

Get step-by-step solutions from verified subject matter experts