

The following graph shows how the stock price of a company has fluctuated over the three years.
Fantastic news! We've Found the answer you've been seeking!
Question:
The following graph shows how the stock price of a company has fluctuated over the three years.
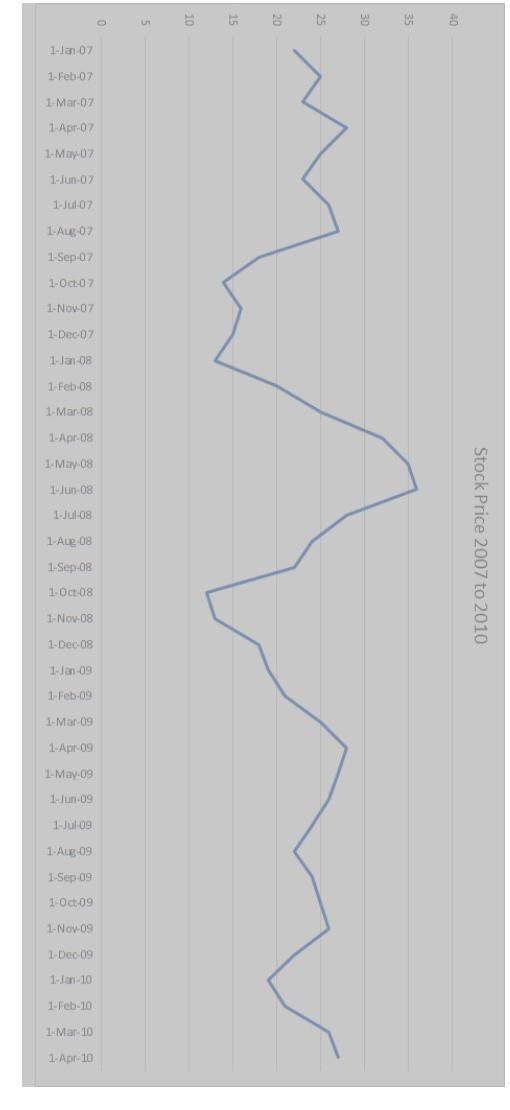
Another company was looking to invest their earnings in buying stock of this company. When would have been a good time to purchase stock, and when would have been a good time to sell to maximize their profit?
Expert Answer:
Based on the graph the best time to purchase stock would have been in 2009 when the price was at its ... View the full answer

Related Book For 

Foundations of Financial Management
ISBN: 978-1259024979
10th Canadian edition
Authors: Stanley Block, Geoffrey Hirt, Bartley Danielsen, Doug Short, Michael Perretta
Posted Date:
