

Question: The following graph shows the aggregate demand ( A D 1 ) and aggregate supply ( AS ) curves for a hypothetical economy with Natural
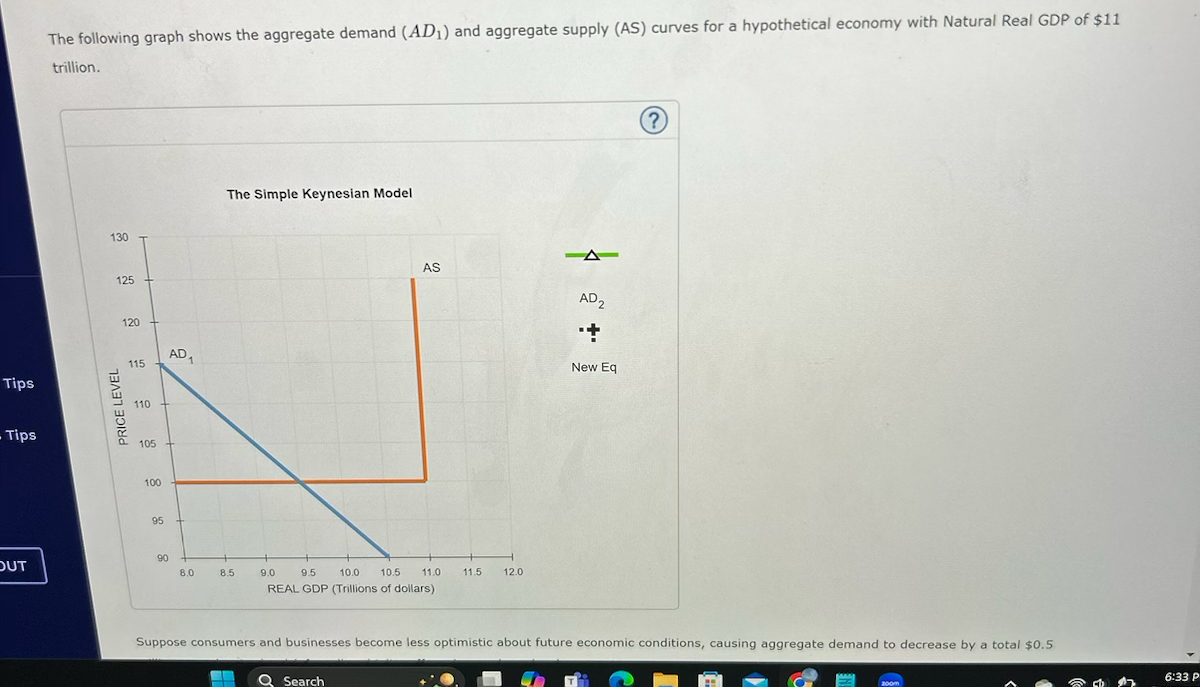
The following graph shows the aggregate demand and aggregate supply AS curves for a hypothetical economy with Natural Real GDP of $ trillion.
The Simple Keynesian Model
Tips
Tips
Suppose consumers and businesses become less optimistic about future economic conditions, causing aggregate demand to decrease by a total $
Step by Step Solution
There are 3 Steps involved in it
1 Expert Approved Answer
Step: 1 Unlock

Question Has Been Solved by an Expert!
Get step-by-step solutions from verified subject matter experts
Step: 2 Unlock
Step: 3 Unlock