

Question: The following graph shows the aggregate demand ( AD ) and aggregate supply ( AS ) curves in the goods and services market before the
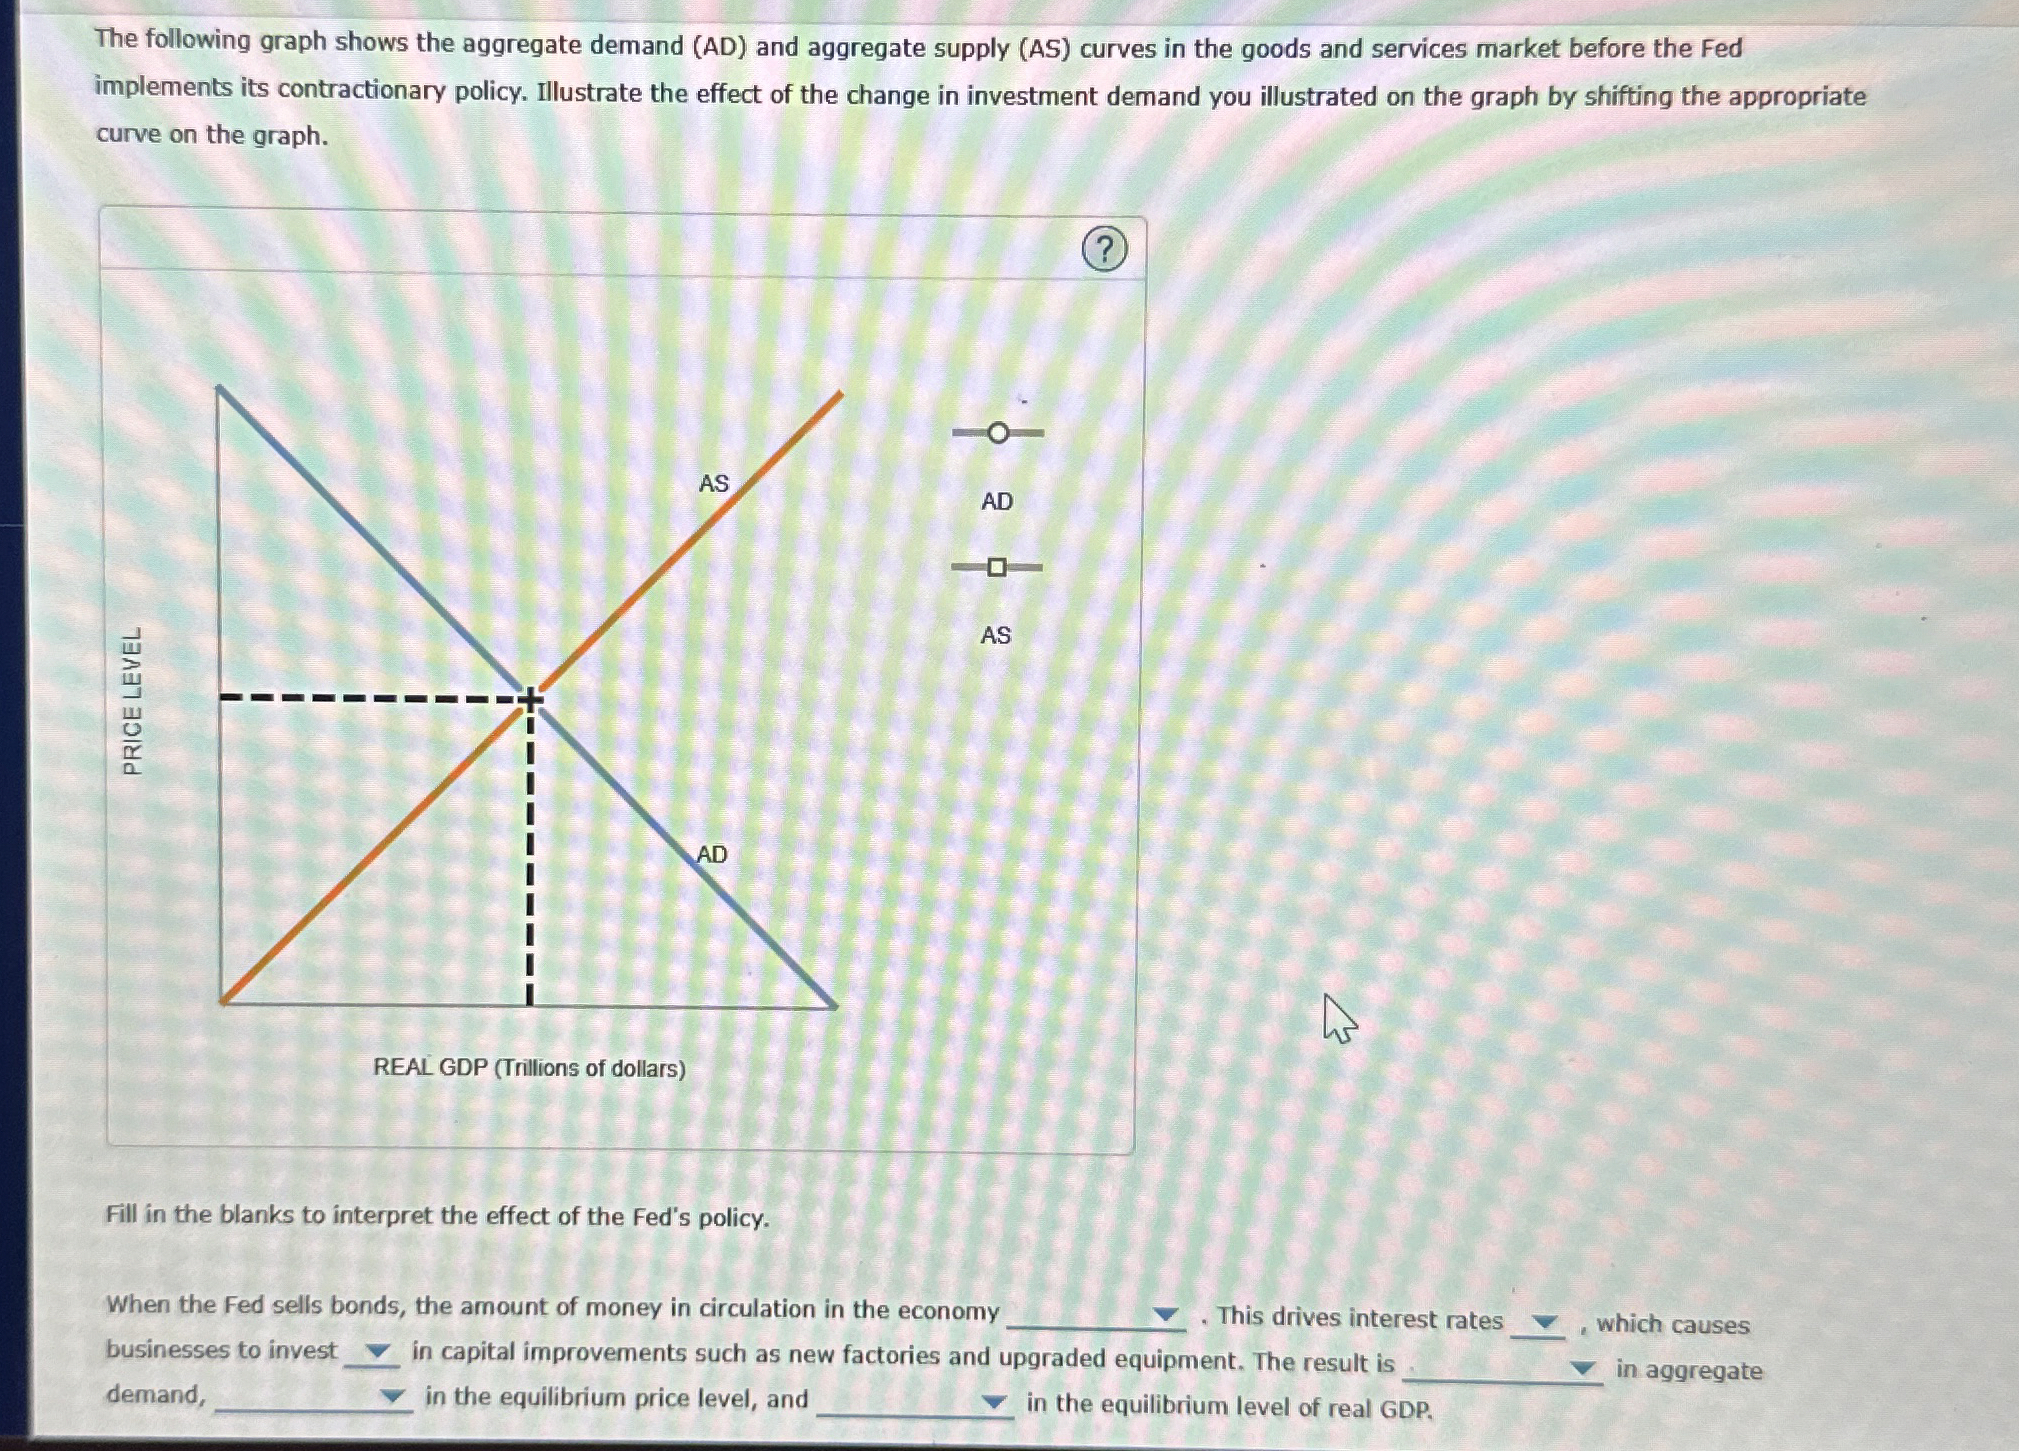
The following graph shows the aggregate demand AD and aggregate supply AS curves in the goods and services market before the Fed implements its contractionary policy. Illustrate the effect of the change in investment demand you illustrated on the graph by shifting the appropriate curve on the graph.
Fill in the blanks to interpret the effect of the Fed's policy.
When the Fed sells bonds, the amount of money in circulation in the economy This drives interest rates which causes businesses to invest in capital improvements such as new factories and upgraded equipment. The result is in aggregate demand, in the equilibrium price level, and in the equilibrium level of real GDP
Step by Step Solution
There are 3 Steps involved in it
1 Expert Approved Answer
Step: 1 Unlock

Question Has Been Solved by an Expert!
Get step-by-step solutions from verified subject matter experts
Step: 2 Unlock
Step: 3 Unlock