

Question: The following graph shows the cyclical component of the HP filter of the log of real GDP and the log of the Index of Industrial
The following graph shows the cyclical component of the HP filter of the log of real GDP and the log of the Index of Industrial Production for the United States (the Index of Industrial Production is a measure of manufacturing output. Its normalized to be equal to 100 in 2012).
a.) Based on this graph, is industrial production procyclical or countercyclical? Explain your answer.
b.) Based on this graph, is industrial production leading, lagging, or coincident? Explain your answer.
c.) Based on this graph, is industrial production more or less volatile than GDP? Explain your answer.
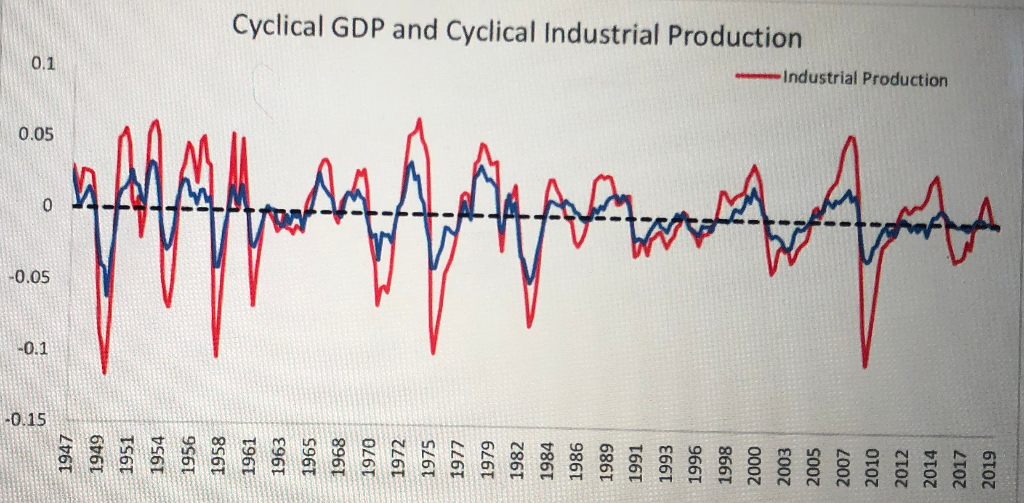
-0.15 -0.05 o 0.1 1947 1949 1951 1954 1956 1958 1961 1963 1965 1968 1970 1972 1975 1977 1979 1982 1984 1986 1989 1991 1993 1996 1998 2000 2003 2005 2007 Cyclical GDP and Cyclical Industrial Production 2010 Industrial Production 2012 2014 2017 2019 -0.15 -0.05 o 0.1 1947 1949 1951 1954 1956 1958 1961 1963 1965 1968 1970 1972 1975 1977 1979 1982 1984 1986 1989 1991 1993 1996 1998 2000 2003 2005 2007 Cyclical GDP and Cyclical Industrial Production 2010 Industrial Production 2012 2014 2017 2019
Step by Step Solution
There are 3 Steps involved in it

Get step-by-step solutions from verified subject matter experts