

Question: The following graph shows the long - run aggregate - supply curve ( LRAS ) , the short - run aggregate - supply curve (
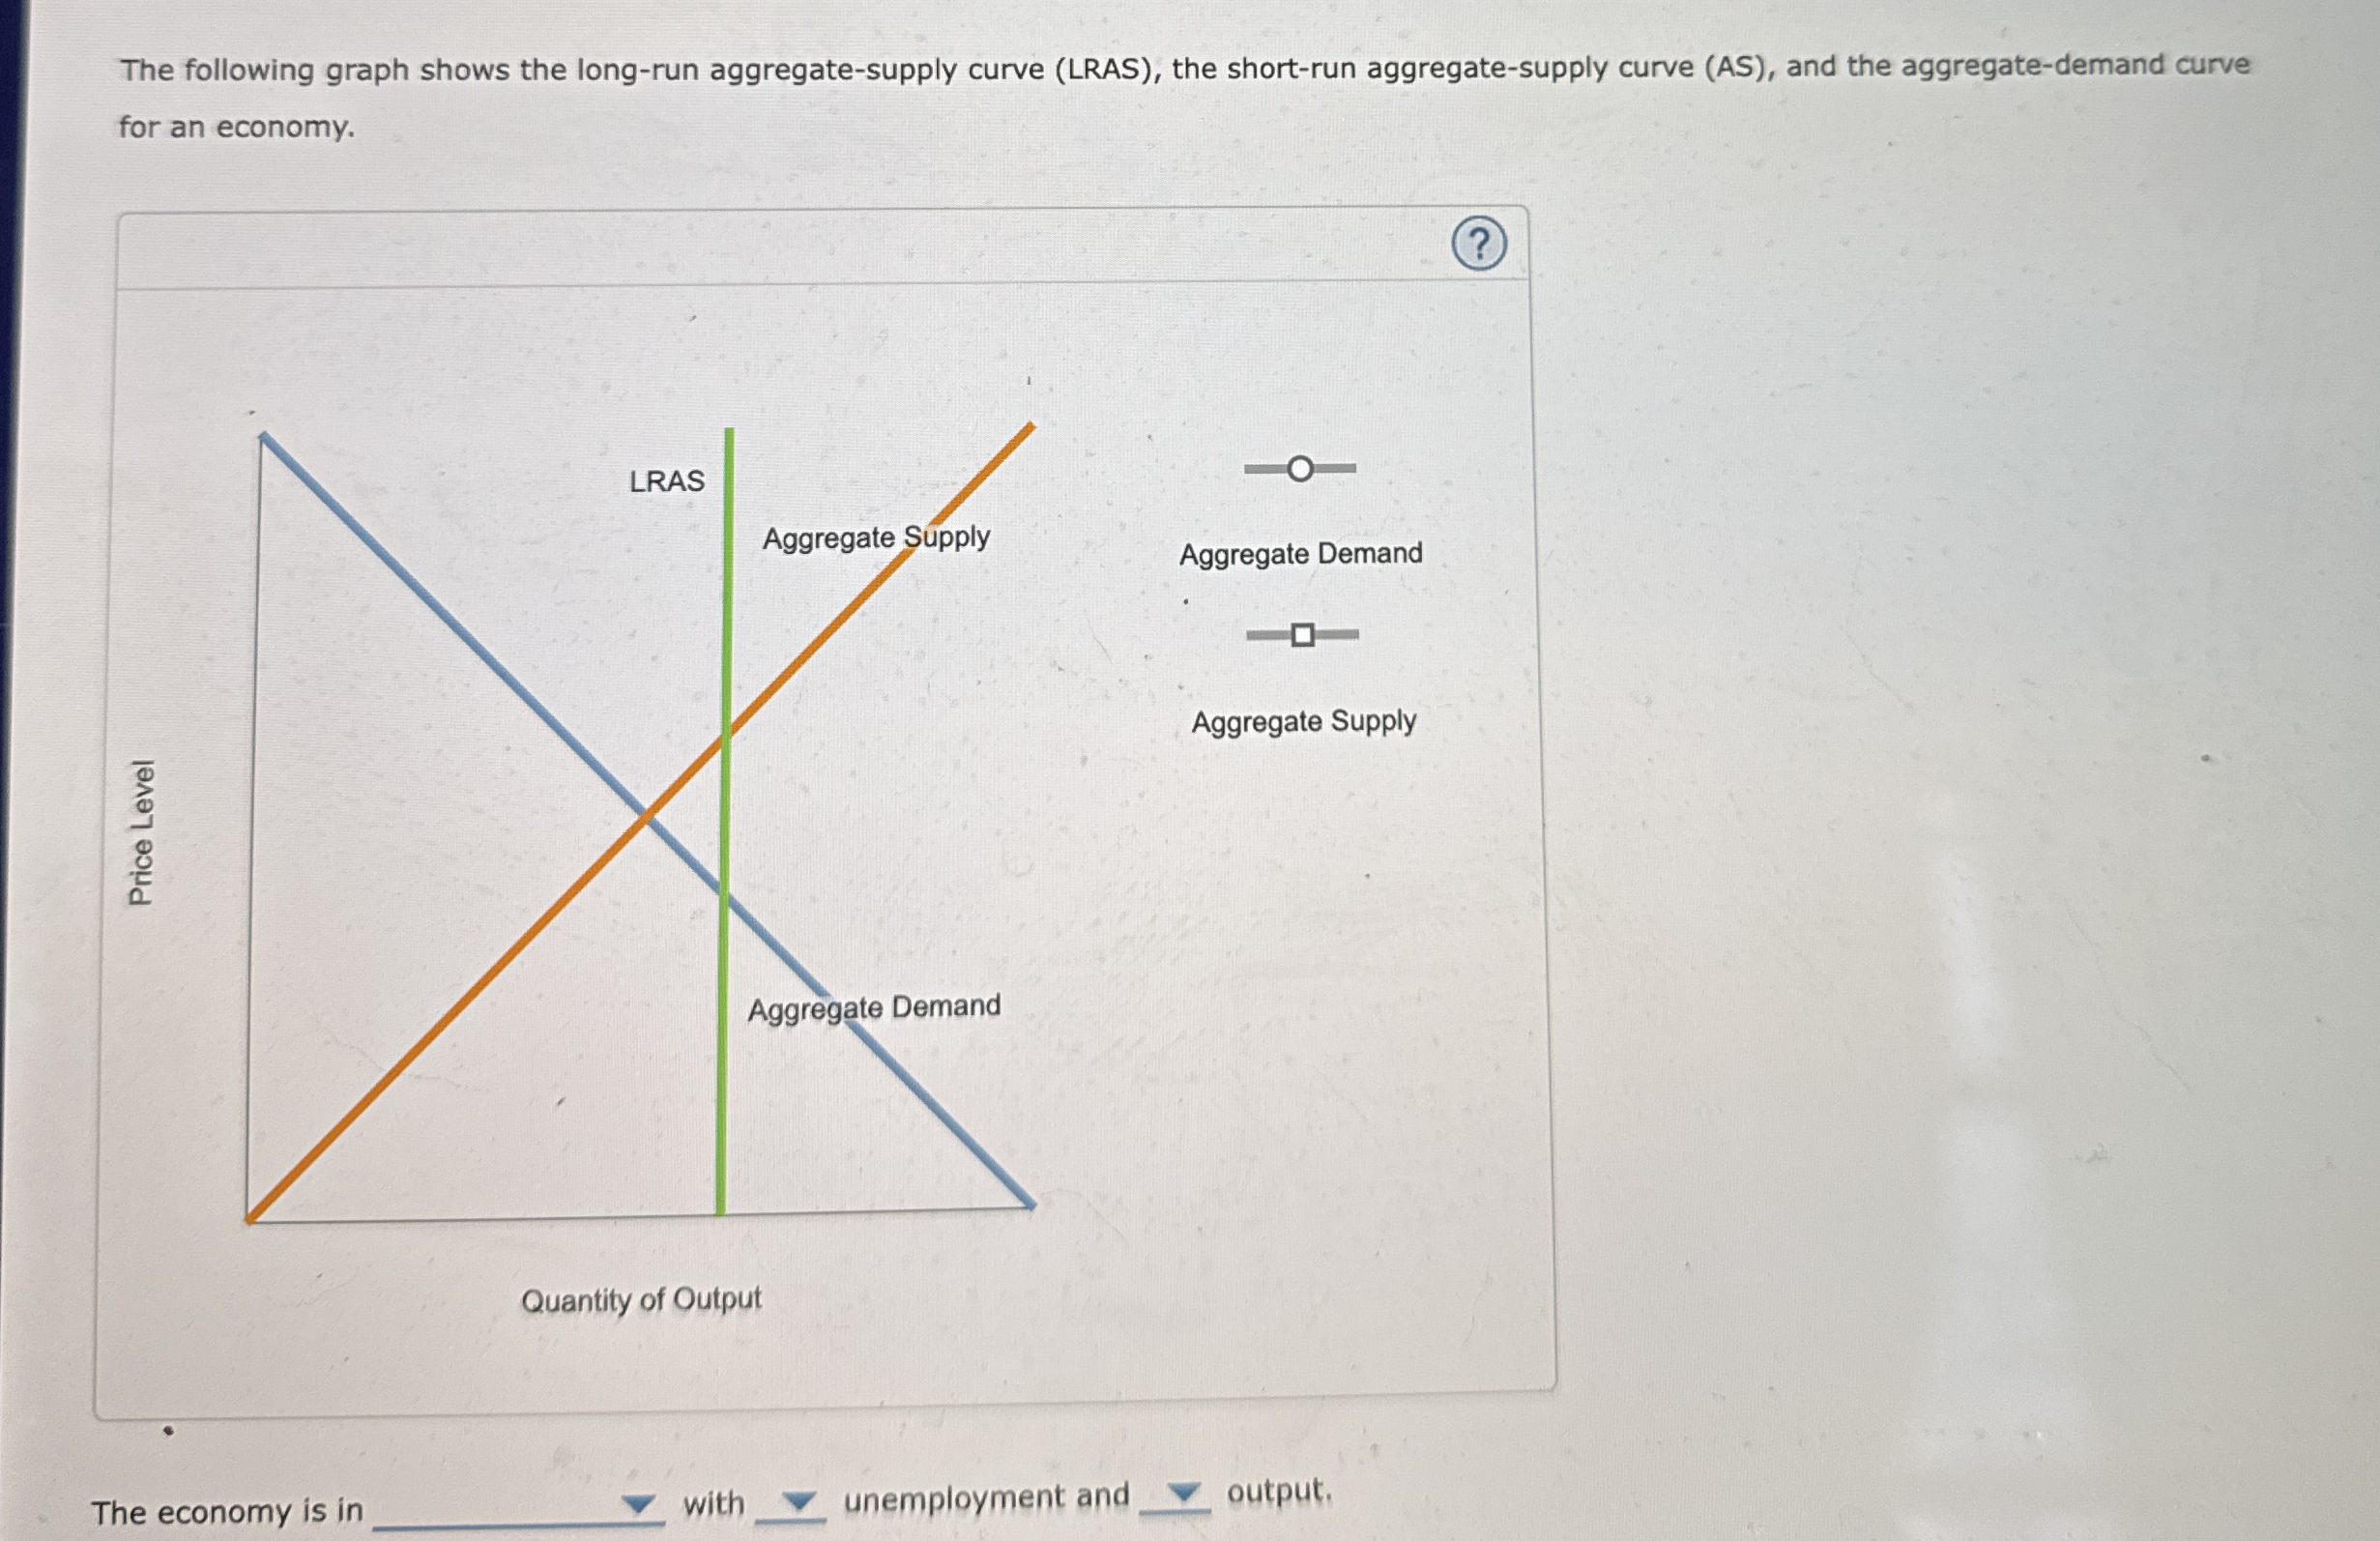
The following graph shows the longrun aggregatesupply curve LRAS the shortrun aggregatesupply curve AS and the aggregatedemand curve for an economy.
The economy is in with unemployment and output.
Step by Step Solution
There are 3 Steps involved in it
1 Expert Approved Answer
Step: 1 Unlock

Question Has Been Solved by an Expert!
Get step-by-step solutions from verified subject matter experts
Step: 2 Unlock
Step: 3 Unlock