

The following graph shows the market for euros, which is initially in equilibrium. Suppose an economic expansion
Question:
The following graph shows the market for euros, which is initially in equilibrium. Suppose an economic expansion in Canada leads to an increase in the incomes of Canadian households, causing imports from Europe to rise.
On the graph, illustrate the effect of an economic expansion on the market for euros by shifting the appropriate curve or curves.
Note: Select and drag one or both of the curves to the desired position. Curves will snap into position, so if you try to move a curve and it snaps back to its original position, just drag it a little farther.
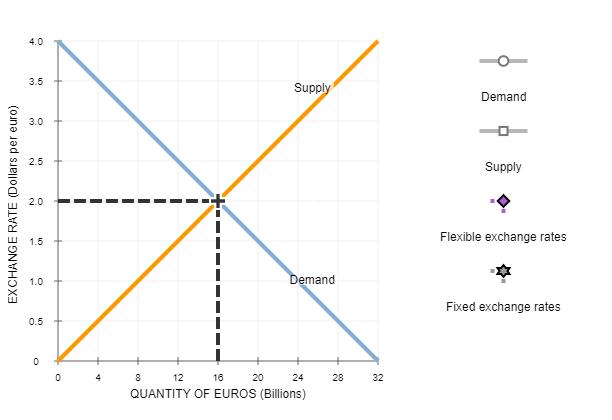
On the previous graph, use the purple point (diamond symbol) to indicate the new equilibrium exchange rate and quantity under a system of flexible exchange rates.
Under a system of flexible exchange rates, the dollar will (depreciate or appreciate) until the foreign exchange market reaches an equilibrium exchange rate of ($2.5 per euro, $2 per euro or 1.5 per euro).
Now suppose that Canada wants to maintain the initial equilibrium exchange rate of $2 per euro.
On the previous graph, use a grey point (star symbol) to indicate the new equilibrium under a system of fixed exchange rates.
Under a system of fixed exchange rates, which of the following policies could the Canadian government use to prevent the change in demand for euros from driving the exchange rate to the new equilibrium? Check all that apply.
Lower interest rates by way of monetary policy
Sell Canadian euro reserves in the foreign exchange market
Reduce income taxes in Canada.
Expert Answer:
1 Effect of Economic Expansion on the Market for Euros An economic expansion in Canada leading to increased incomes of Canadian households and higher ... View the full answer


