

Question: The following graph shows the relationship between a person's weekly salt intake and his or her systolic blood pressure. (? 125 120 115 SYS. BLOOD
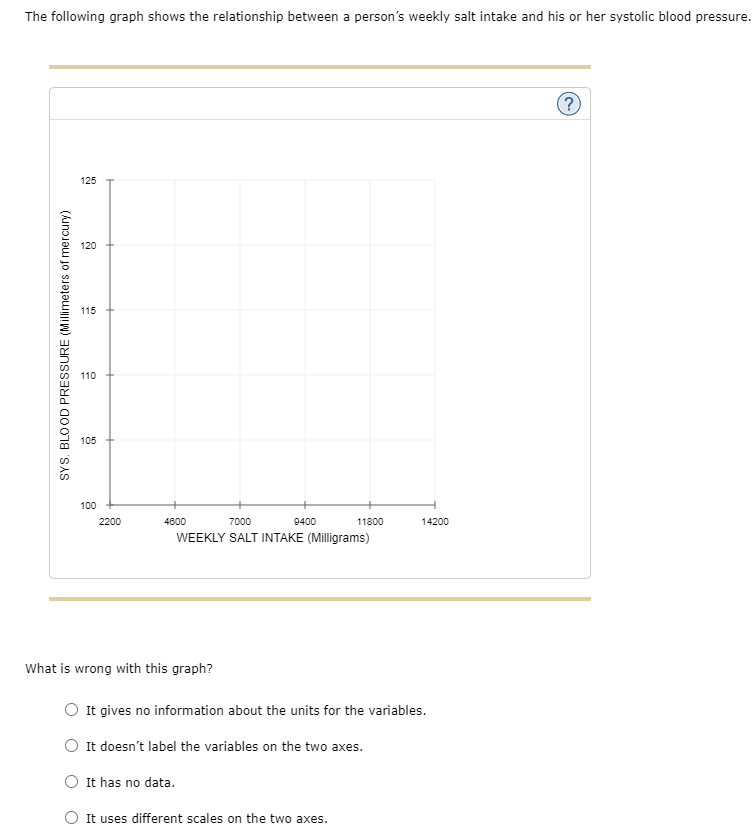
The following graph shows the relationship between a person's weekly salt intake and his or her systolic blood pressure. (? 125 120 115 SYS. BLOOD PRESSURE (Millimeters of mercury) 110 105 100 2200 4600 7000 9400 11800 14200 WEEKLY SALT INTAKE (Milligrams) What is wrong with this graph? O It gives no information about the units for the variables. It doesn't label the variables on the two axes. It has no data. O It uses different scales on the two axes
Step by Step Solution
There are 3 Steps involved in it
1 Expert Approved Answer
Step: 1 Unlock

Question Has Been Solved by an Expert!
Get step-by-step solutions from verified subject matter experts
Step: 2 Unlock
Step: 3 Unlock