

Question: The following graph shows the short - run average total cost curves and the long - run average total cost curve for a publishing firm.
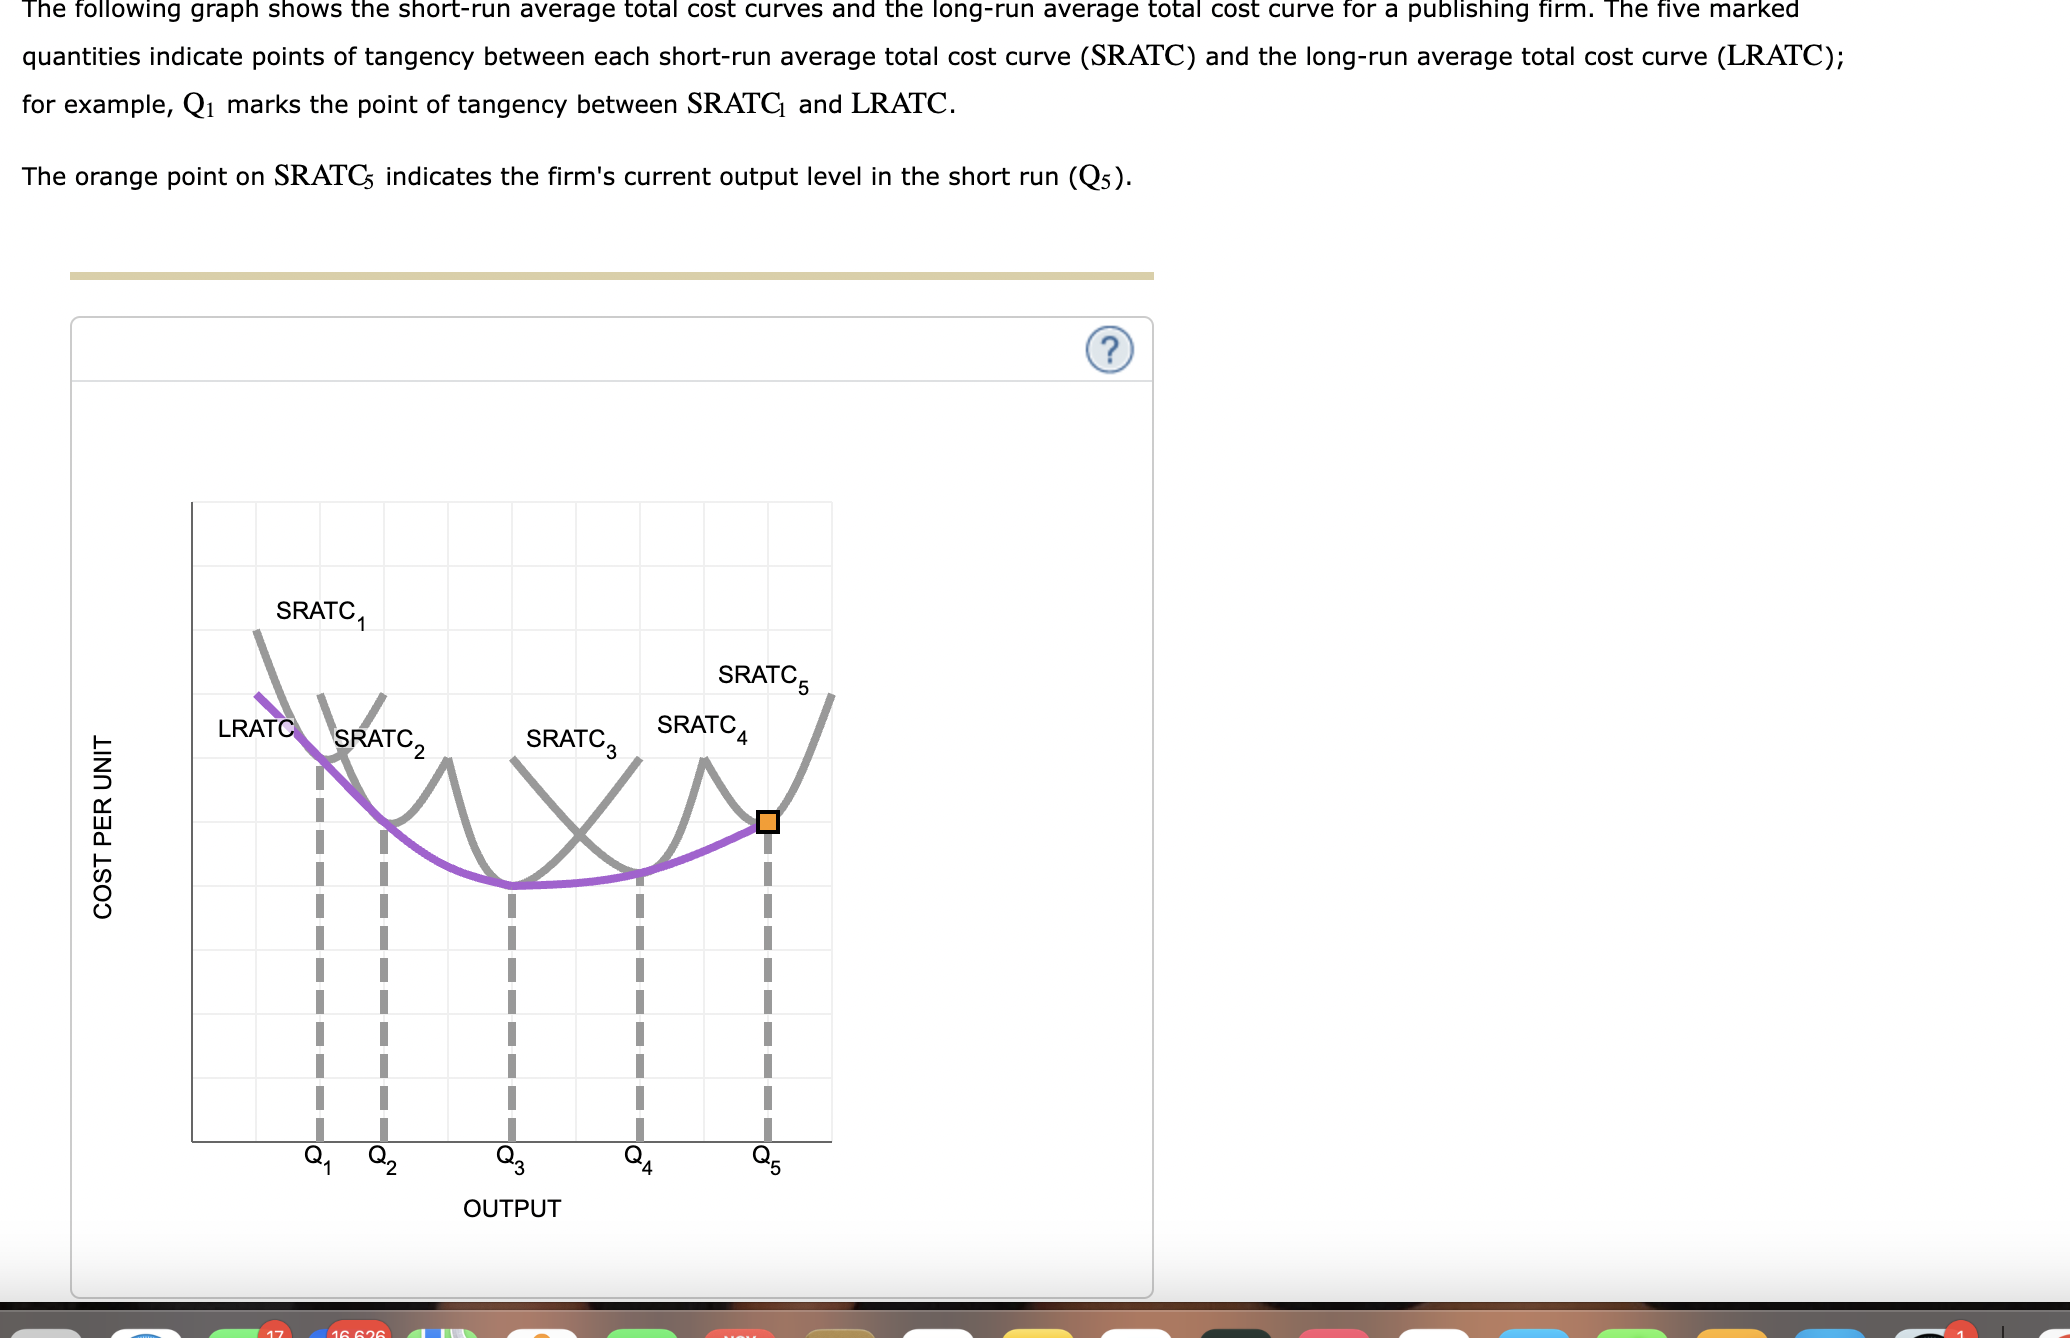
The following graph shows the shortrun average total cost curves and the longrun average total cost curve for a publishing firm. The five marked quantities indicate points tangency between each shortrun average total cost curve and the longrun average total cost curve ; for example, marks the point tangency between SRATCSRATC and LRATCLRATC.
The orange point SRATCSRATC indicates the firm's current output level the short run
The following graph shows the shortrun average total cost curves and the longrun average total cost curve for a publishing firm. The five marked
quantities indicate points tangency between each shortrun average total cost curve and the longrun average total cost curve ;
for example, marks the point tangency between and LRATC.
The orange point indicates the firm's current output level the short run
the long run, the firm decides keep output its initial level, what will likely
Shift operate SRATC
Shut down
Shift operate
Stay SRATC
which output level range output levels does the firm produce its current volume output most efficiently?
Step by Step Solution
There are 3 Steps involved in it
1 Expert Approved Answer
Step: 1 Unlock

Question Has Been Solved by an Expert!
Get step-by-step solutions from verified subject matter experts
Step: 2 Unlock
Step: 3 Unlock