

Question: The following graph shows two Yield Spread curves for AAA-rated and BAArated U.S. Corporate Bonds for the period 2003-2023. The yield spread is calculated as
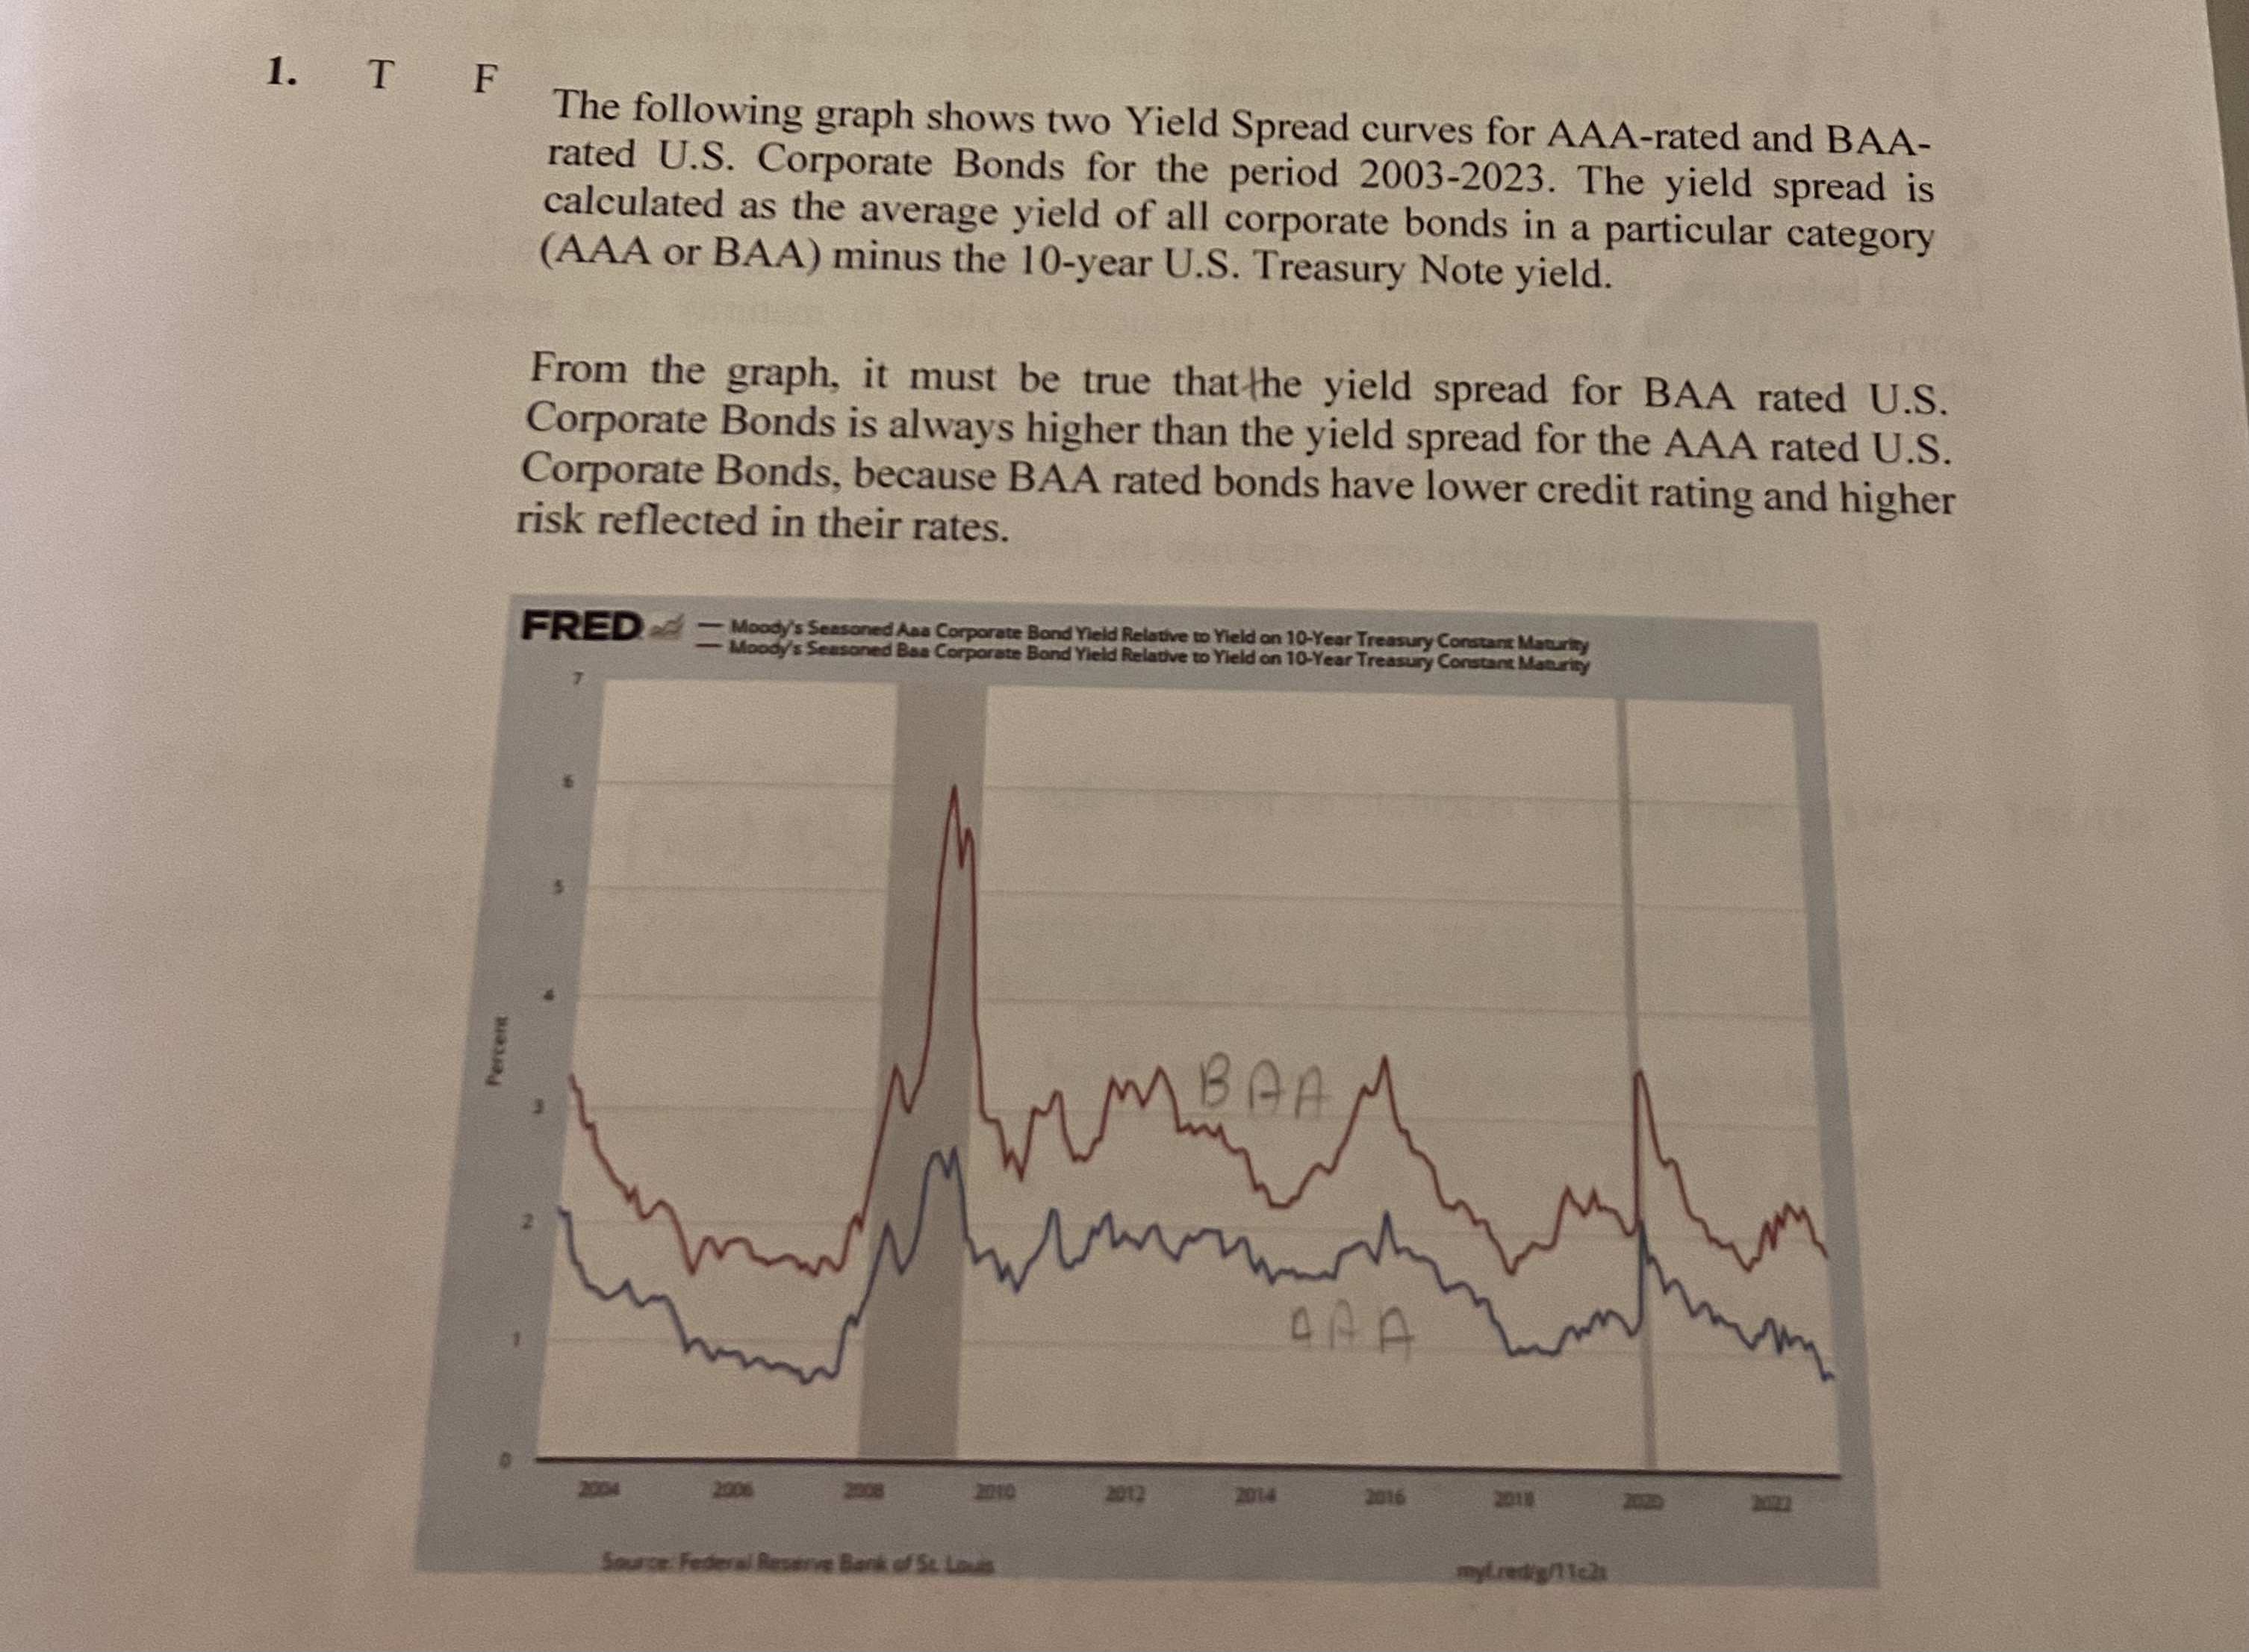
The following graph shows two Yield Spread curves for AAA-rated and BAArated U.S. Corporate Bonds for the period 2003-2023. The yield spread is calculated as the average yield of all corporate bonds in a particular category (AAA or BAA) minus the 10-year U.S. Treasury Note yield. From the graph, it must be true that the yield spread for BAA rated U.S. Corporate Bonds is always higher than the yield spread for the AAA rated U.S. Corporate Bonds, because BAA rated bonds have lower credit rating and higher risk reflected in their rates
Step by Step Solution
There are 3 Steps involved in it
1 Expert Approved Answer
Step: 1 Unlock

Question Has Been Solved by an Expert!
Get step-by-step solutions from verified subject matter experts
Step: 2 Unlock
Step: 3 Unlock