

Question: The following graphs represent various cost behaviour patterns. The vertical axis represents costs and the horizontal axis represents the level of activity. Required: For each
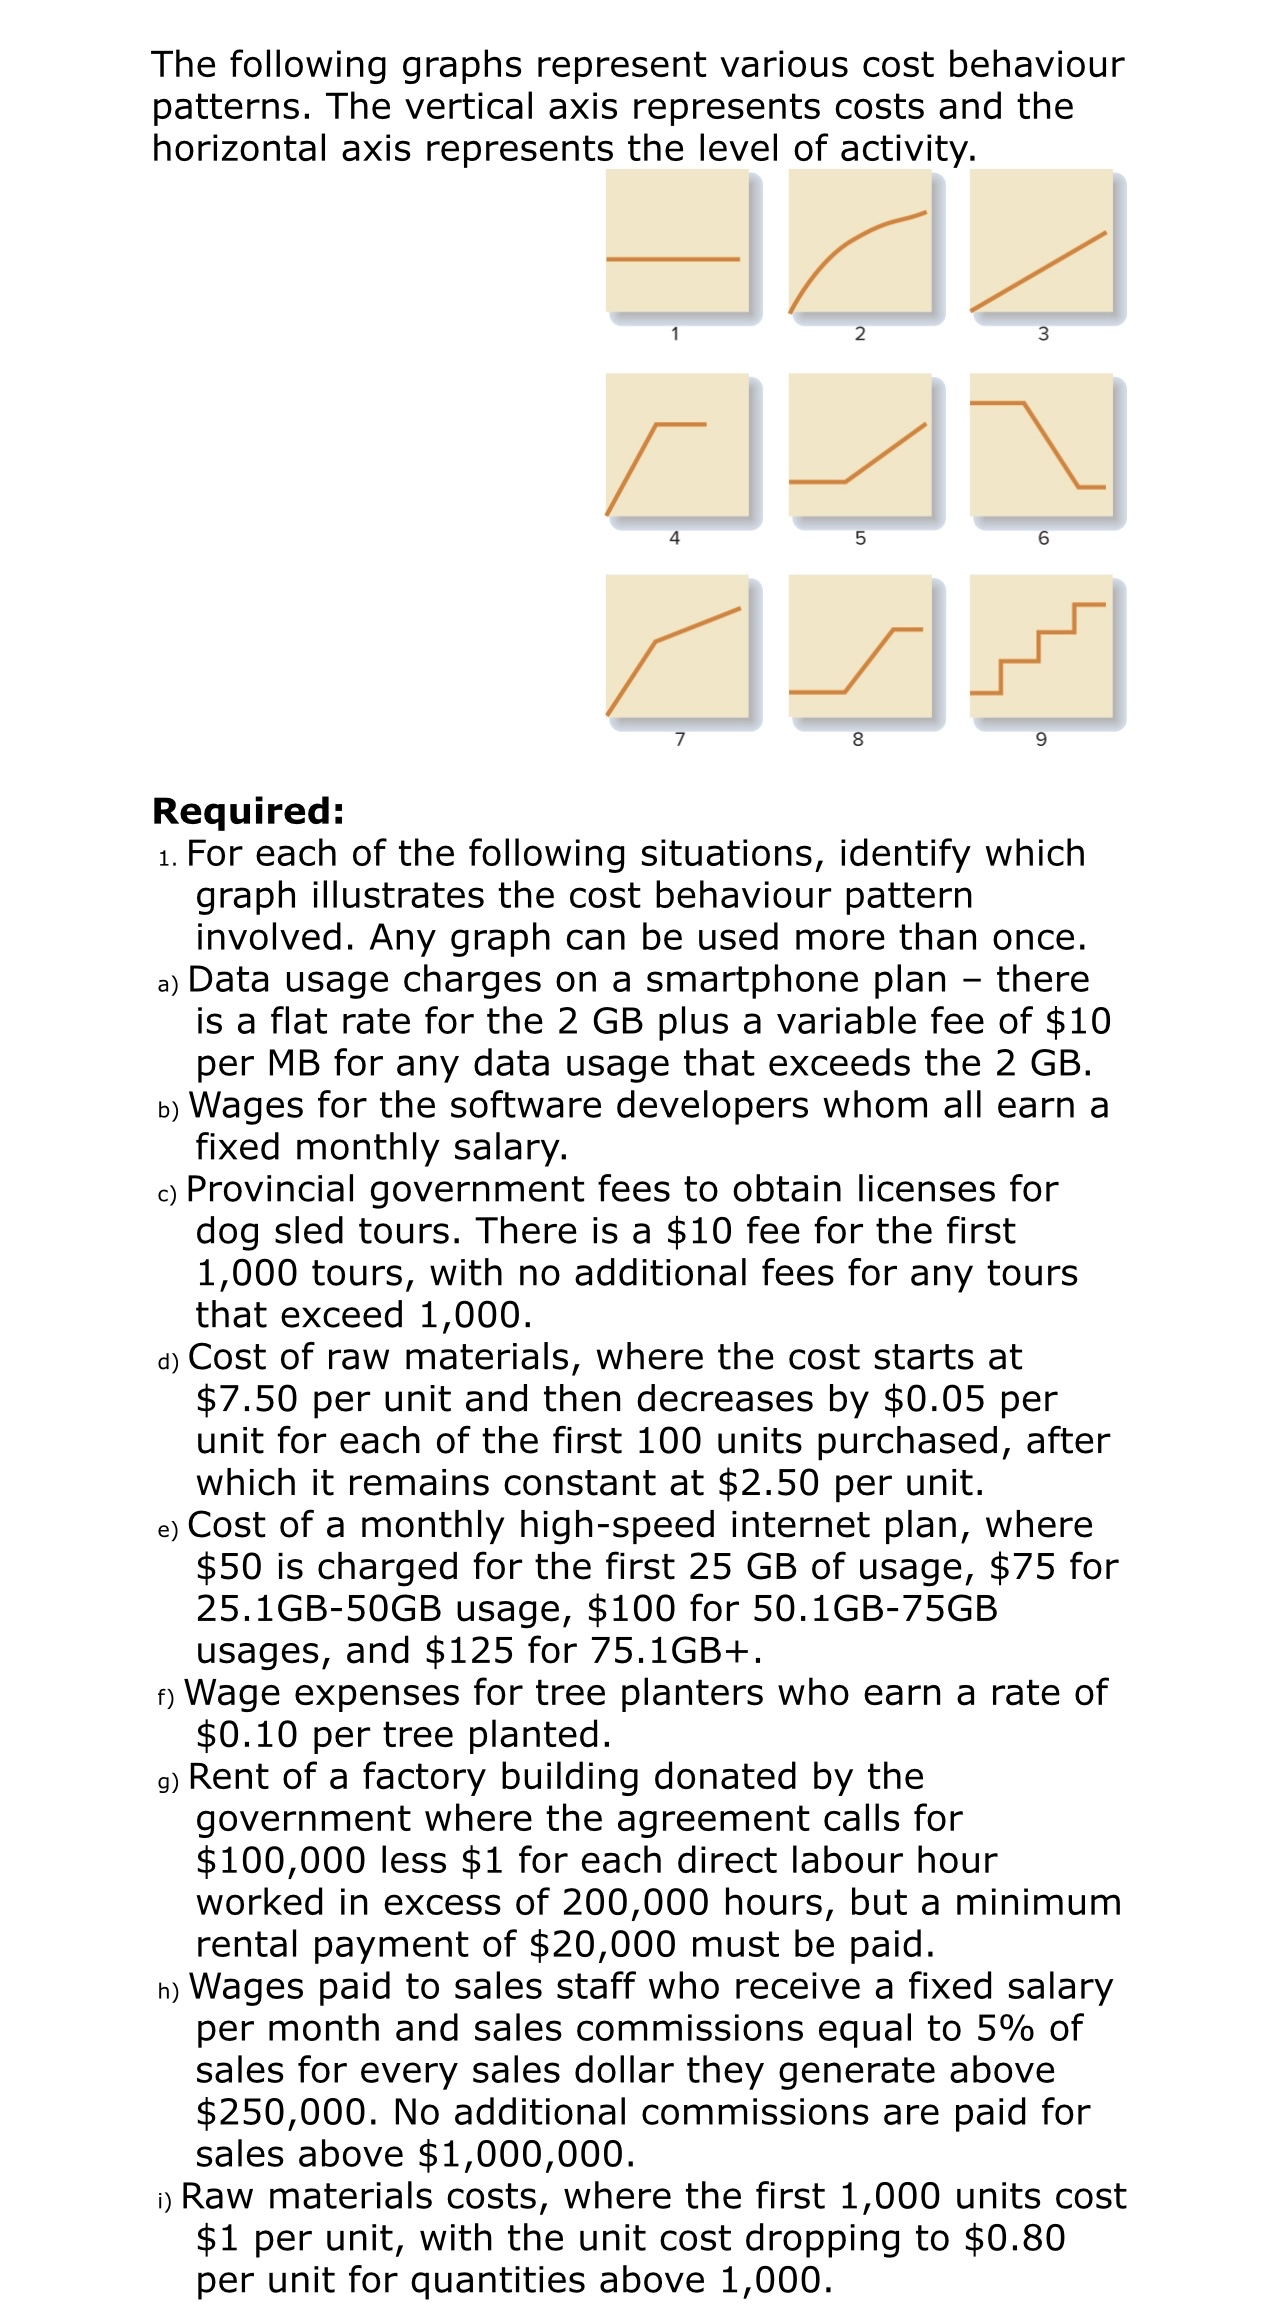
The following graphs represent various cost behaviour patterns. The vertical axis represents costs and the horizontal axis represents the level of activity.
Required:
For each of the following situations, identify which graph illustrates the cost behaviour pattern involved. Any graph can be used more than once.
a Data usage charges on a smartphone plan there is a flat rate for the plus a variable fee of $ per MB for any data usage that exceeds the
b Wages for the software developers whom all earn a fixed monthly salary.
c Provincial government fees to obtain licenses for dog sled tours. There is a $ fee for the first tours, with no additional fees for any tours that exceed
d Cost of raw materials, where the cost starts at $ per unit and then decreases by $ per unit for each of the first units purchased, after which it remains constant at $ per unit.
e Cost of a monthly highspeed internet plan, where $ is charged for the first of usage, $ for GBGB usage, $ for usages, and $ for
f Wage expenses for tree planters who earn a rate of $ per tree planted.
g Rent of a factory building donated by the government where the agreement calls for $ less $ for each direct labour hour worked in excess of hours, but a minimum rental payment of $ must be paid.
h Wages paid to sales staff who receive a fixed salary per month and sales commissions equal to of sales for every sales dollar they generate above $ No additional commissions are paid for sales above $
i Raw materials costs, where the first units cost $ per unit, with the unit cost dropping to $ per unit for quantities above
Step by Step Solution
There are 3 Steps involved in it
1 Expert Approved Answer
Step: 1 Unlock

Question Has Been Solved by an Expert!
Get step-by-step solutions from verified subject matter experts
Step: 2 Unlock
Step: 3 Unlock