

Question: _ The following gure represents the histogram and probability plot for three different data sets: Select the charts {there can he more than one} which

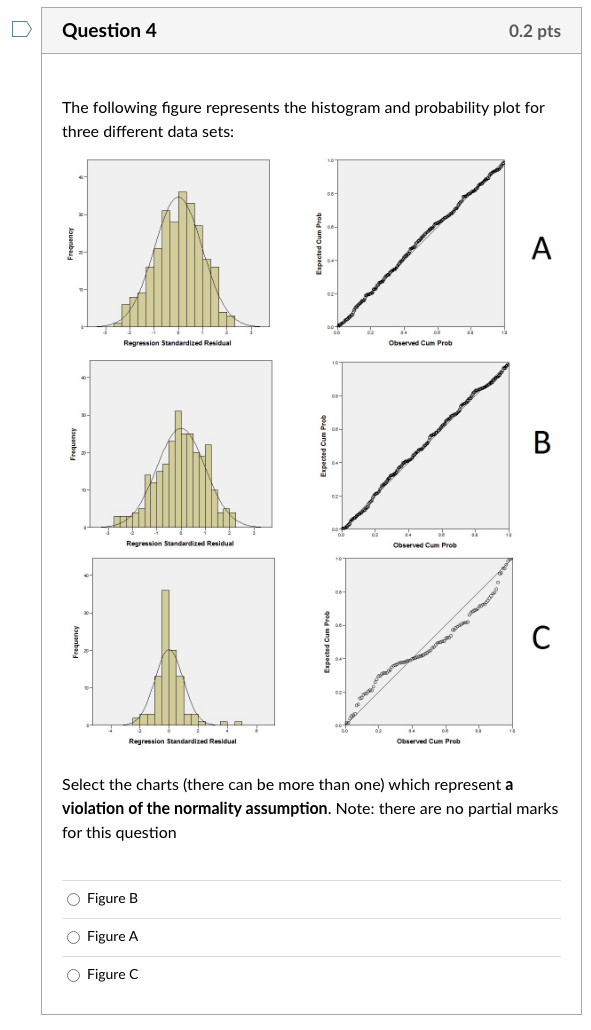
_ The following gure represents the histogram and probability plot for three different data sets: Select the charts {there can he more than one} which represent a 1uriolation of the normality assumption. Note: there are no partial marks for this question C) Figure B C) Figure A. C) Figure {2
Step by Step Solution
There are 3 Steps involved in it
1 Expert Approved Answer
Step: 1 Unlock

Question Has Been Solved by an Expert!
Get step-by-step solutions from verified subject matter experts
Step: 2 Unlock
Step: 3 Unlock