

Question: The following is a table (1) that summarizes some selected financial ratios of Apple Inc. for the three recent years from 2019 till 2021
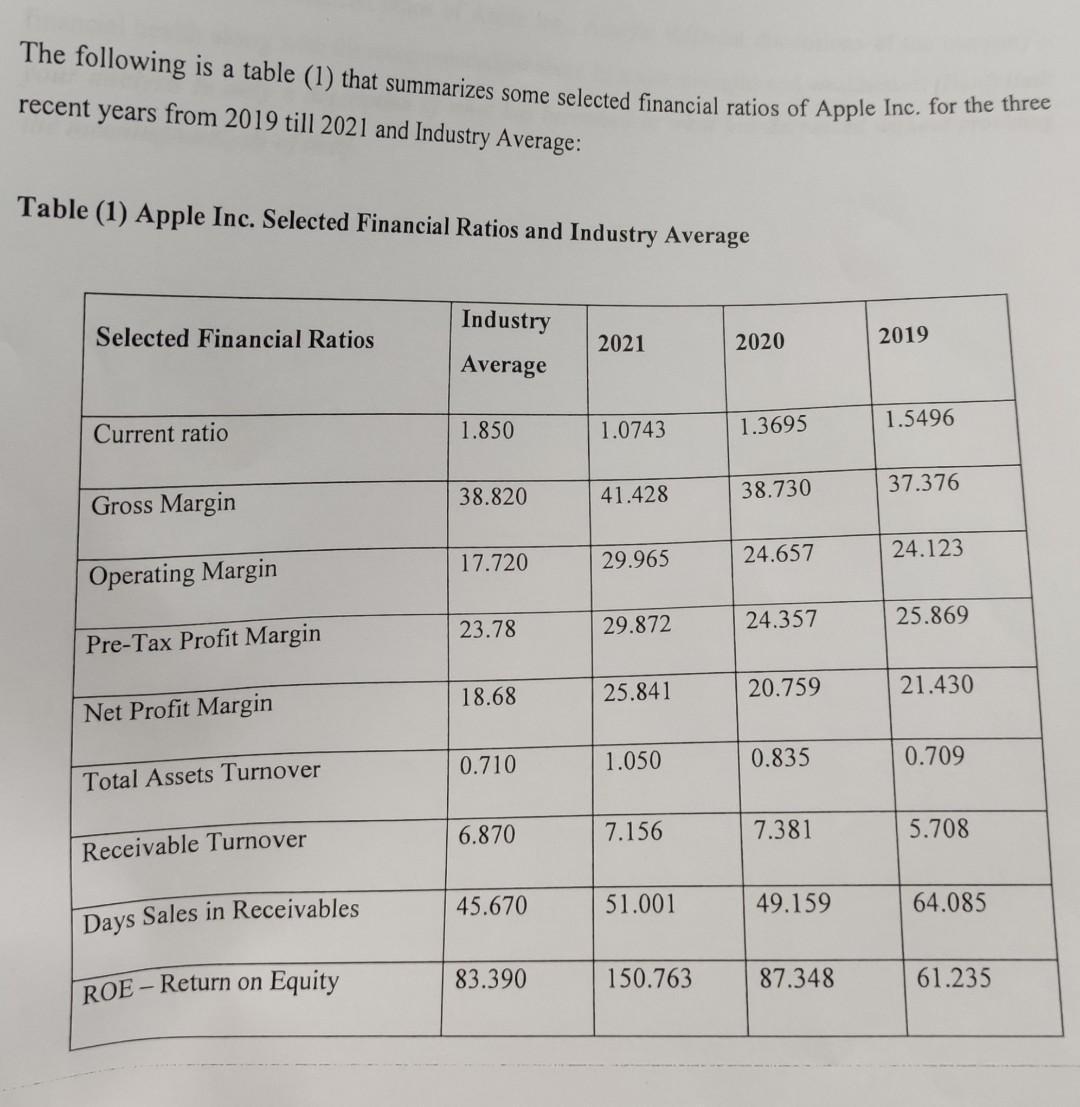
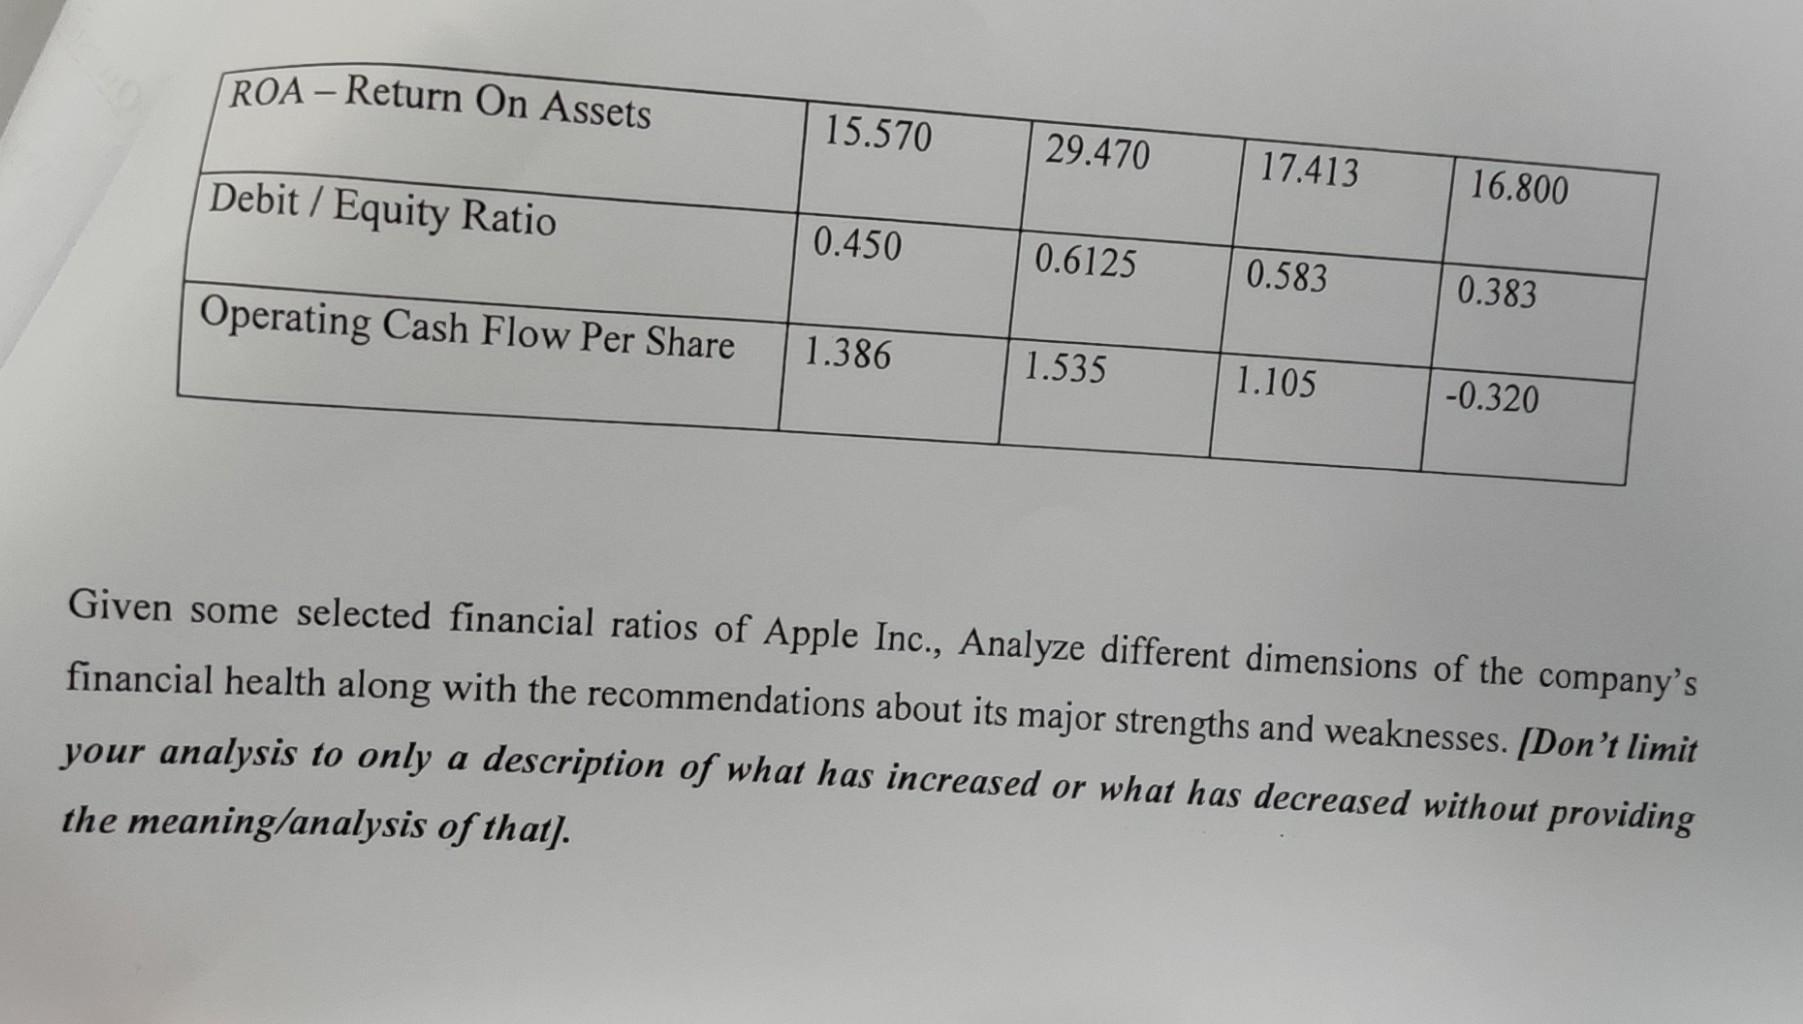
The following is a table (1) that summarizes some selected financial ratios of Apple Inc. for the three recent years from 2019 till 2021 and Industry Average: Table (1) Apple Inc. Selected Financial Ratios and Industry Average Selected Financial Ratios Current ratio Gross Margin Operating Margin Pre-Tax Profit Margin Net Profit Margin Total Assets Turnover Receivable Turnover Days Sales in Receivables ROE-Return on Equity Industry Average 1.850 38.820 17.720 23.78 18.68 0.710 6.870 45.670 83.390 2021 1.0743 41.428 29.965 29.872 25.841 1.050 7.156 51.001 150.763 2020 1.3695 38.730 24.657 24.357 20.759 0.835 7.381 49.159 87.348 2019 1.5496 37.376 24.123 25.869 21.430 0.709 5.708 64.085 61.235 ROA - Return On Assets 15.570 Debit/Equity Ratio Operating Cash Flow Per Share 1.386 0.450 29.470 0.6125 1.535 17.413 0.583 1.105 16.800 0.383 -0.320 Given some selected financial ratios of Apple Inc., Analyze different dimensions of the company's financial health along with the recommendations about its major strengths and weaknesses. [Don't limit your analysis to only a description of what has increased or what has decreased without providing the meaning/analysis of that].
Step by Step Solution
3.39 Rating (158 Votes )
There are 3 Steps involved in it
Based on the financial ratios provided in Table 1 we can analyze various dimensions of Apple Incs fi... View full answer

Get step-by-step solutions from verified subject matter experts