

Question: The following is data gathered from a sample that was randomly gathered from a normally distributable population. The Y axes is a measure of how
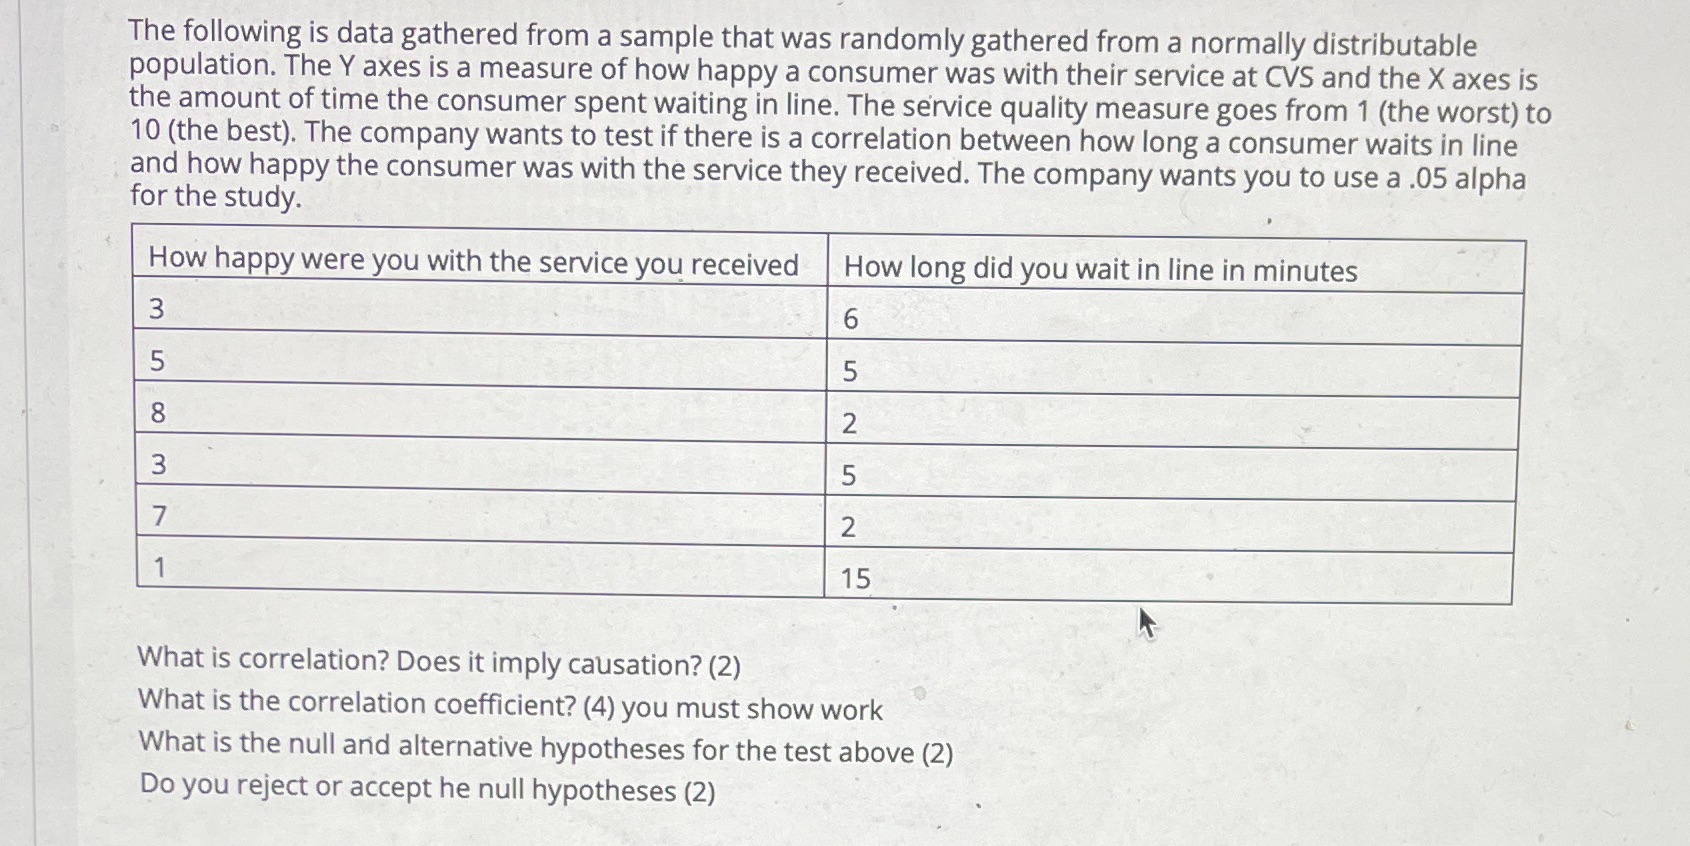

The following is data gathered from a sample that was randomly gathered from a normally distributable population. The Y axes is a measure of how happy a consumer was with their service at CVS and the X axes is the amount of time the consumer spent waiting in line. The service quality measure goes from 1 (the worst) to 10 (the best). The company wants to test if there is a correlation between how long a consumer waits in line and how happy the consumer was with the service they received. The company wants you to use a .05 alpha for the study. How happy were you with the service you received How long did you wait in line in minutes 3 6 5 5 8 2 3 5 7 2 15 What is correlation? Does it imply causation? (2) What is the correlation coefficient? (4) you must show work What is the null and alternative hypotheses for the test above (2) Do you reject or accept he null hypotheses (2)
Step by Step Solution
There are 3 Steps involved in it

Get step-by-step solutions from verified subject matter experts