

Question: The following is the rock, paper, scissors data collected from a previous class. Win Loss Tie Rock 21 16 18 Paper 13 14 29
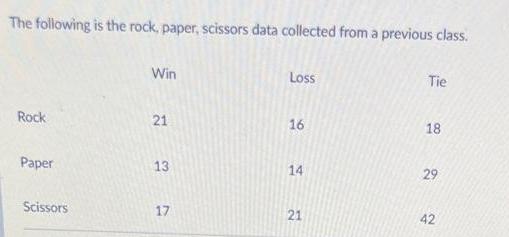
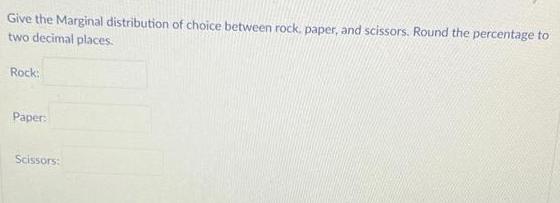


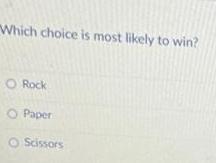

The following is the rock, paper, scissors data collected from a previous class. Win Loss Tie Rock 21 16 18 Paper 13 14 29 Scissors 17 21 42 Give the Marginal distribution of choice between rock, paper, and scissors. Round the percentage to two decimal places. Rock: Paper: Scissors: Give the conditional distribution of result (win, loss, tie) given choice (rock, paper, scissors). Round each percent to two decimal places when necessary. Win Loss Tie Rock Paper Scissors Create a multiple bar graph for result given the choice of rock, paper, scissors. (This means to first break it into chunks of choice of rock paper scissors, and then within each choice find out how many won, lost, or tied). Use the conditional distribution as the y axis. Which choice is most likely to win? O Rock O Paper O Scissors Do you believe these results would carry to a larger population? Why?
Step by Step Solution
3.45 Rating (155 Votes )
There are 3 Steps involved in it
A B C D E F G H K M win lose tie total Rock 21 16 18 55 12000 ... View full answer

Get step-by-step solutions from verified subject matter experts