

Question: The following joint probability distribution function table shows the likelihood of the number of times (X) different age groups of people (Y) have left their
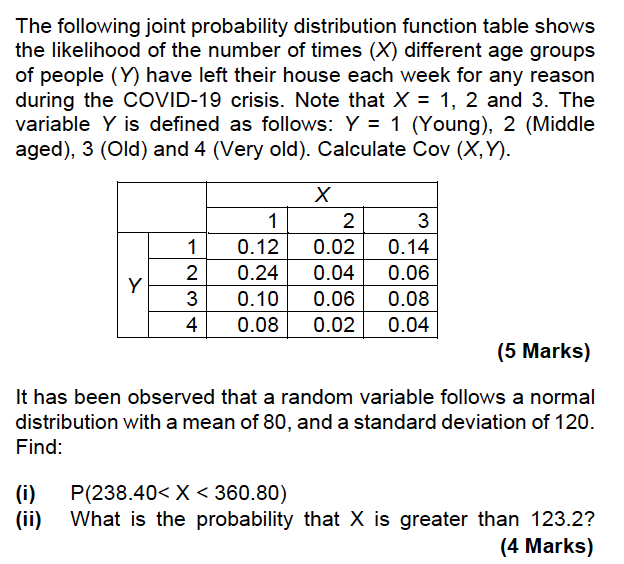

The following joint probability distribution function table shows the likelihood of the number of times (X) different age groups of people (Y) have left their house each week for any reason during the COVID-19 crisis. Note that X = 1, 2 and 3. The variable Y is defined as follows: Y = 1 (Young), 2 (Middle aged), 3 (Old) and 4 (Very old). Calculate Cov (X, Y). X 1 2 3 0.12 0.02 0.14 2 0.24 0.04 0.06 Y 3 0.10 0.06 0.08 4 0.08 0.02 0.04 (5 Marks) It has been observed that a random variable follows a normal distribution with a mean of 80, and a standard deviation of 120. Find: (i) P(238.40
Step by Step Solution
There are 3 Steps involved in it
1 Expert Approved Answer
Step: 1 Unlock

Question Has Been Solved by an Expert!
Get step-by-step solutions from verified subject matter experts
Step: 2 Unlock
Step: 3 Unlock