

Question: The following moisture - density data are results from a laboratory standard proctor compaction test on a given soil: ( a ) Plot the compaction
The following moisturedensity data are results from a laboratory standard proctor compaction test on a given soil: a Plot the compaction curves on a suitable graph or using an excel spreadsheet, and indicate the maximum dry unit weight and optimum moisture content. b What range of water contents would be acceptable if the specifications call for a relative compaction, and water content should be wet of optimum? Represent the moisture content range on the compaction plot. c What is the maximum degree of saturation achieved during the compaction tests that were performed?Problem
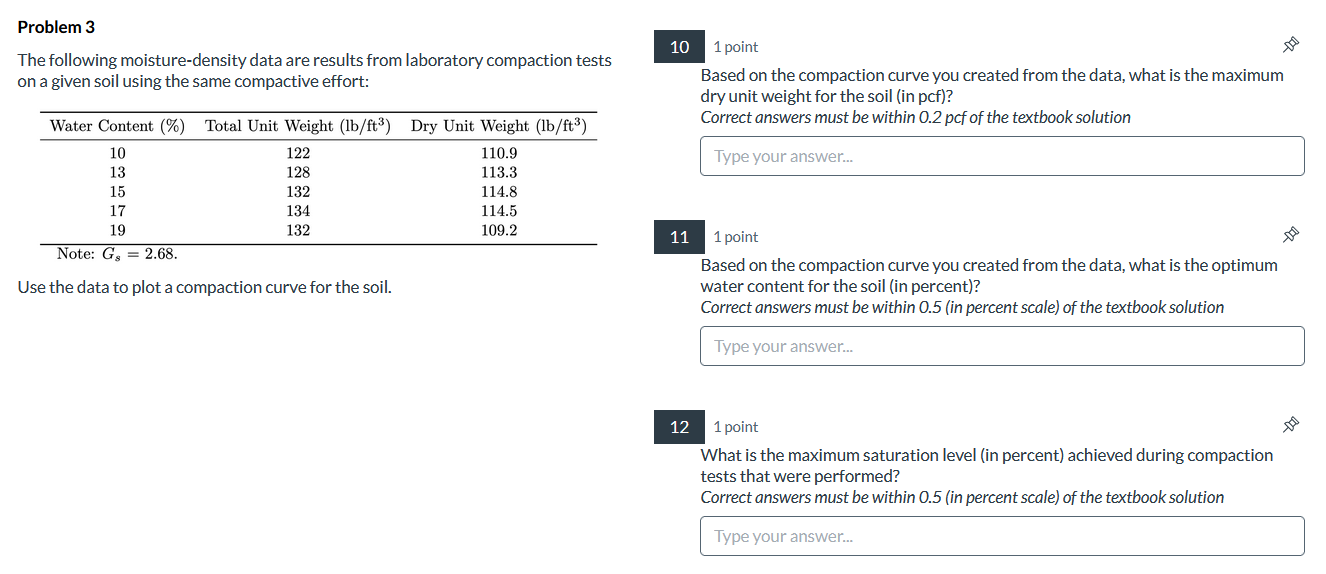
The following moisturedensity data are results from laboratory compaction tests
on a given soil using the same compactive effort:
Note:
Use the data to plot a compaction curve for the soil.
Based on the compaction curve you created from the data, what is the maximum
dry unit weight for the soil in pcf
Correct answers must be within pcf of the textbook solution
Based on the compaction curve you created from the data, what is the optimum
water content for the soil in percent
Correct answers must be within in percent scale of the textbook solution
point
What is the maximum saturation level in percent achieved during compaction
tests that were performed?
Correct answers must be within in percent scale of the textbook solution
Step by Step Solution
There are 3 Steps involved in it
1 Expert Approved Answer
Step: 1 Unlock

Question Has Been Solved by an Expert!
Get step-by-step solutions from verified subject matter experts
Step: 2 Unlock
Step: 3 Unlock