

Question: The following output is from a single factor ANOVA test: SUMMARY Groups Count Sum Mean Variance Group 1 53 10.6 1.3 Group 2 66 13.2

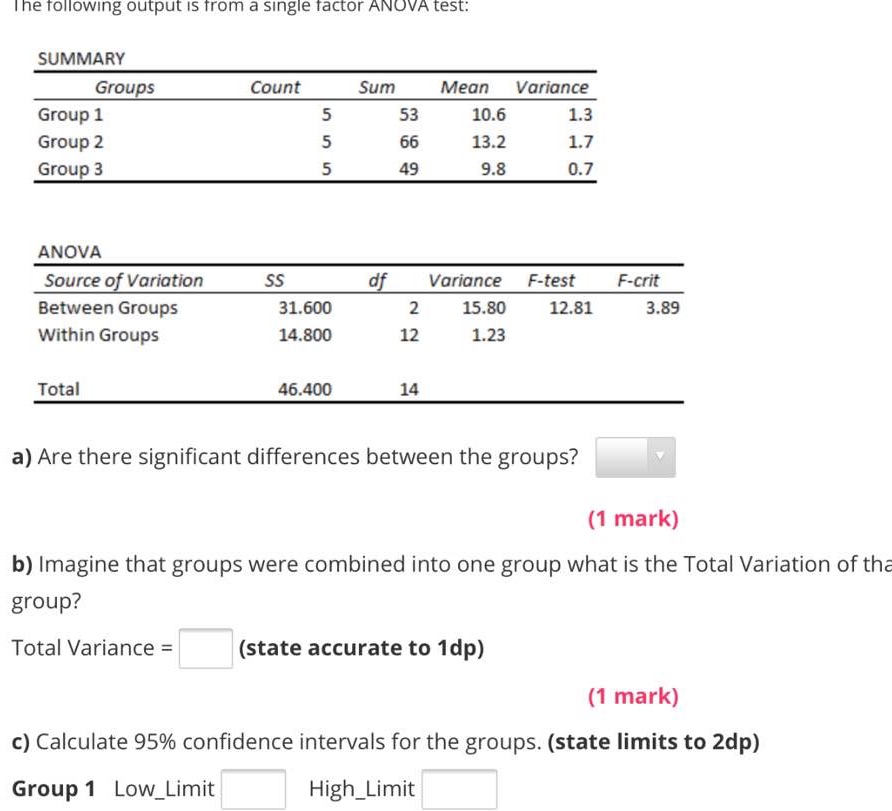
The following output is from a single factor ANOVA test: SUMMARY Groups Count Sum Mean Variance Group 1 53 10.6 1.3 Group 2 66 13.2 1.7 Group 3 49 9.8 0.7 ANOVA Source of Variation SS of Variance F-test F-crit Between Groups 31.600 2 15.80 12.81 3.89 Within Groups 14.800 12 1.23 Total 46.400 14 a) Are there significant differences between the groups? (1 mark) b) Imagine that groups were combined into one group what is the Total Variation of tha group? Total Variance = (state accurate to 1dp) (1 mark) c) Calculate 95% confidence intervals for the groups. (state limits to 2dp) Group 1 Low_Limit High_Limit
Step by Step Solution
There are 3 Steps involved in it
1 Expert Approved Answer
Step: 1 Unlock

Question Has Been Solved by an Expert!
Get step-by-step solutions from verified subject matter experts
Step: 2 Unlock
Step: 3 Unlock