

Question: The following output shows a centroid table produced by running k-means clustering in R on a dataset of analyticsball players with k-4. Each data point
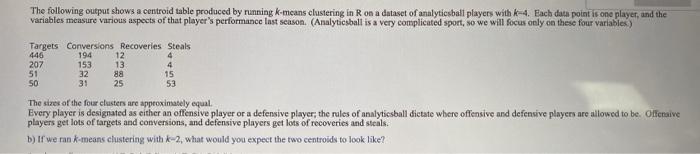
The following output shows a centroid table produced by running k-means clustering in R on a dataset of analyticsball players with k-4. Each data point is one player, and the variables measure various aspects of that player's performance last season. (Analyticsball is a very complicated sport, so we will focus only on these four variables.) Targets Conversions Recoveries Steals 446 194 12 4 207 13 4 51 32 88 15 SO 31 25 53 153 The size of the four clusters are approximately equal Every player is designated as either an offensive player or a defensive player, the rules of analyticsball dictate where offensive and defensive players are allowed to be. Offensive players get lots of targets and conversions, and defensive players get lots of recoveries and steals. b) If we rank-means clustering with k-2, what would you expect the two centroids to look like? The following output shows a centroid table produced by running k-means clustering in R on a dataset of analyticsball players with k-4. Each data point is one player, and the variables measure various aspects of that player's performance last season. (Analyticsball is a very complicated sport, so we will focus only on these four variables.) Targets Conversions Recoveries Steals 446 194 12 4 207 13 4 51 32 88 15 SO 31 25 53 153 The size of the four clusters are approximately equal Every player is designated as either an offensive player or a defensive player, the rules of analyticsball dictate where offensive and defensive players are allowed to be. Offensive players get lots of targets and conversions, and defensive players get lots of recoveries and steals. b) If we rank-means clustering with k-2, what would you expect the two centroids to look like
Step by Step Solution
There are 3 Steps involved in it

Get step-by-step solutions from verified subject matter experts