

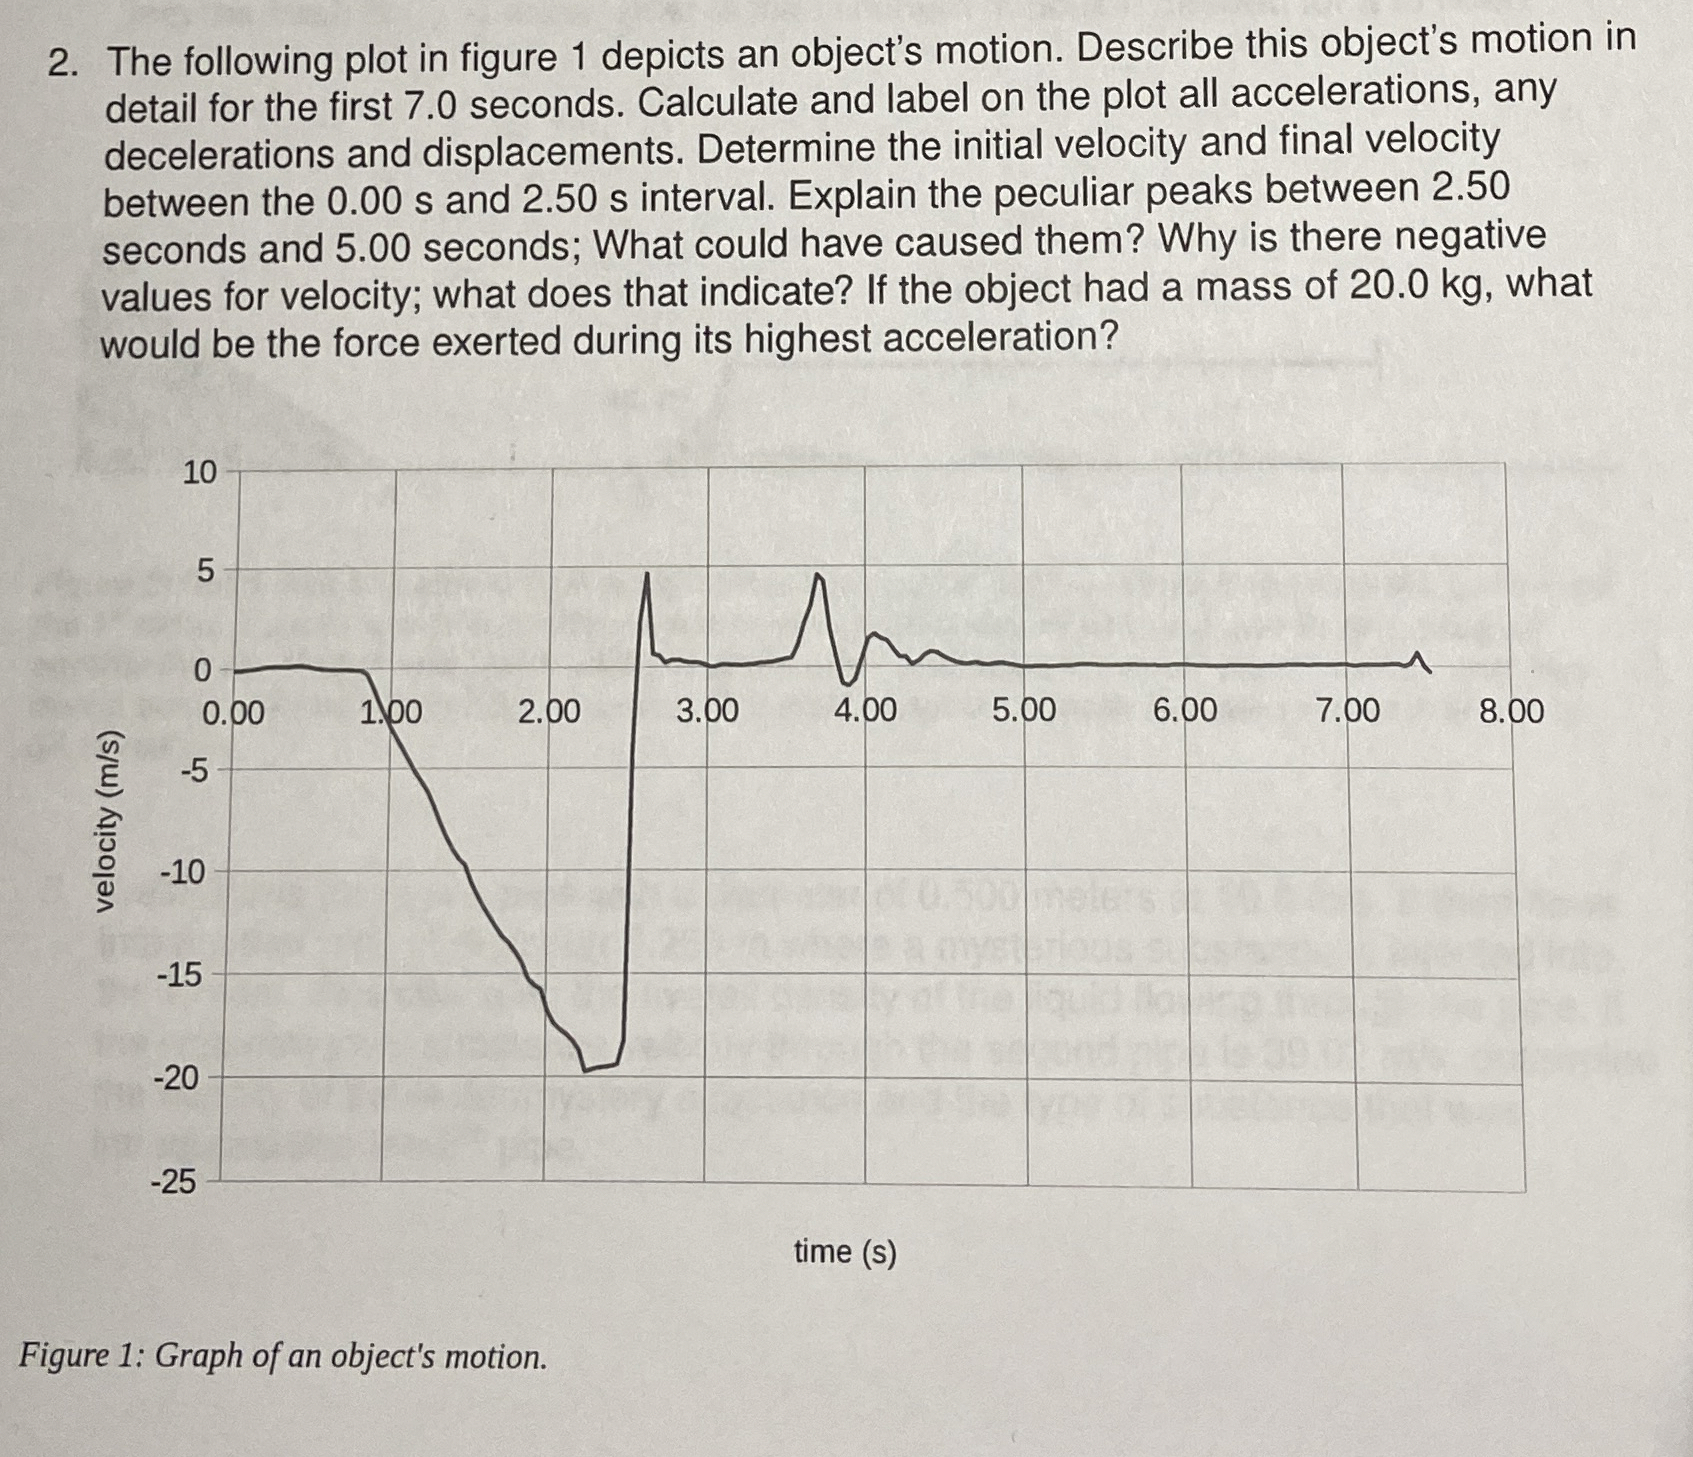
Question: The following plot in figure 1 depicts an object's motion. Describe this object's motion in detail for the first 7 . 0 seconds. Calculate and
The following plot in figure depicts an object's motion. Describe this object's motion in detail for the first seconds. Calculate and label on the plot all accelerations, any decelerations and displacements. Determine the initial velocity and final velocity between the s and s interval. Explain the peculiar peaks between seconds and seconds; What could have caused them? Why is there negative values for velocity; what does that indicate? If the object had a mass of kg what would be the force exerted during its highest acceleration?
Step by Step Solution
There are 3 Steps involved in it
1 Expert Approved Answer
Step: 1 Unlock

Question Has Been Solved by an Expert!
Get step-by-step solutions from verified subject matter experts
Step: 2 Unlock
Step: 3 Unlock