

Question: The following plot is a sampling distribution for the average Hollywood Movie Budget from the early 2000 s in millions of dollars Sampling Dotplot of

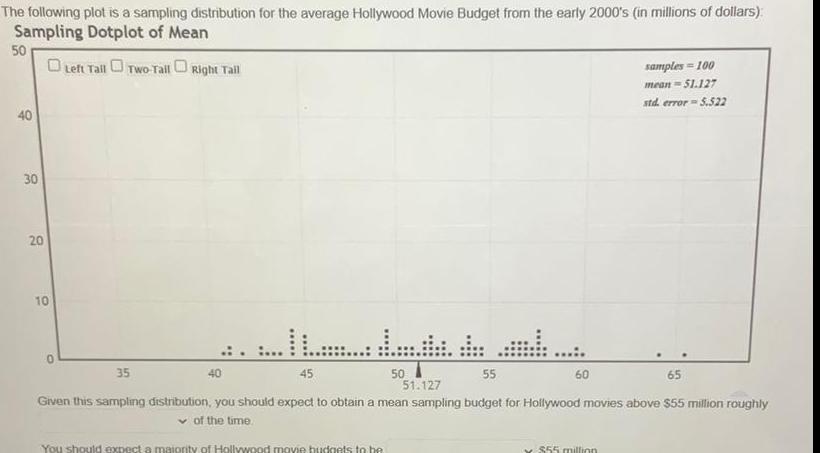
The following plot is a sampling distribution for the average Hollywood Movie Budget from the early 2000 s in millions of dollars Sampling Dotplot of Mean Left Tail Two Tail Right Tail 50 40 30 20 10 0 35 40 IL 45 50 You should expect a majority of Hollywood movie budgets to be 60 55 65 51 127 Given this sampling distribution you should expect to obtain a mean sampling budget for Hollywood movies above 55 million roughly of the time samples 100 mean 51 127 std error 5 522 55 million
Step by Step Solution
There are 3 Steps involved in it
1 Expert Approved Answer
Step: 1 Unlock

Question Has Been Solved by an Expert!
Get step-by-step solutions from verified subject matter experts
Step: 2 Unlock
Step: 3 Unlock