

Question: The following plot shows a scatterplot of data on X and y variables. The data points are represented by solid circles, and the triangle in
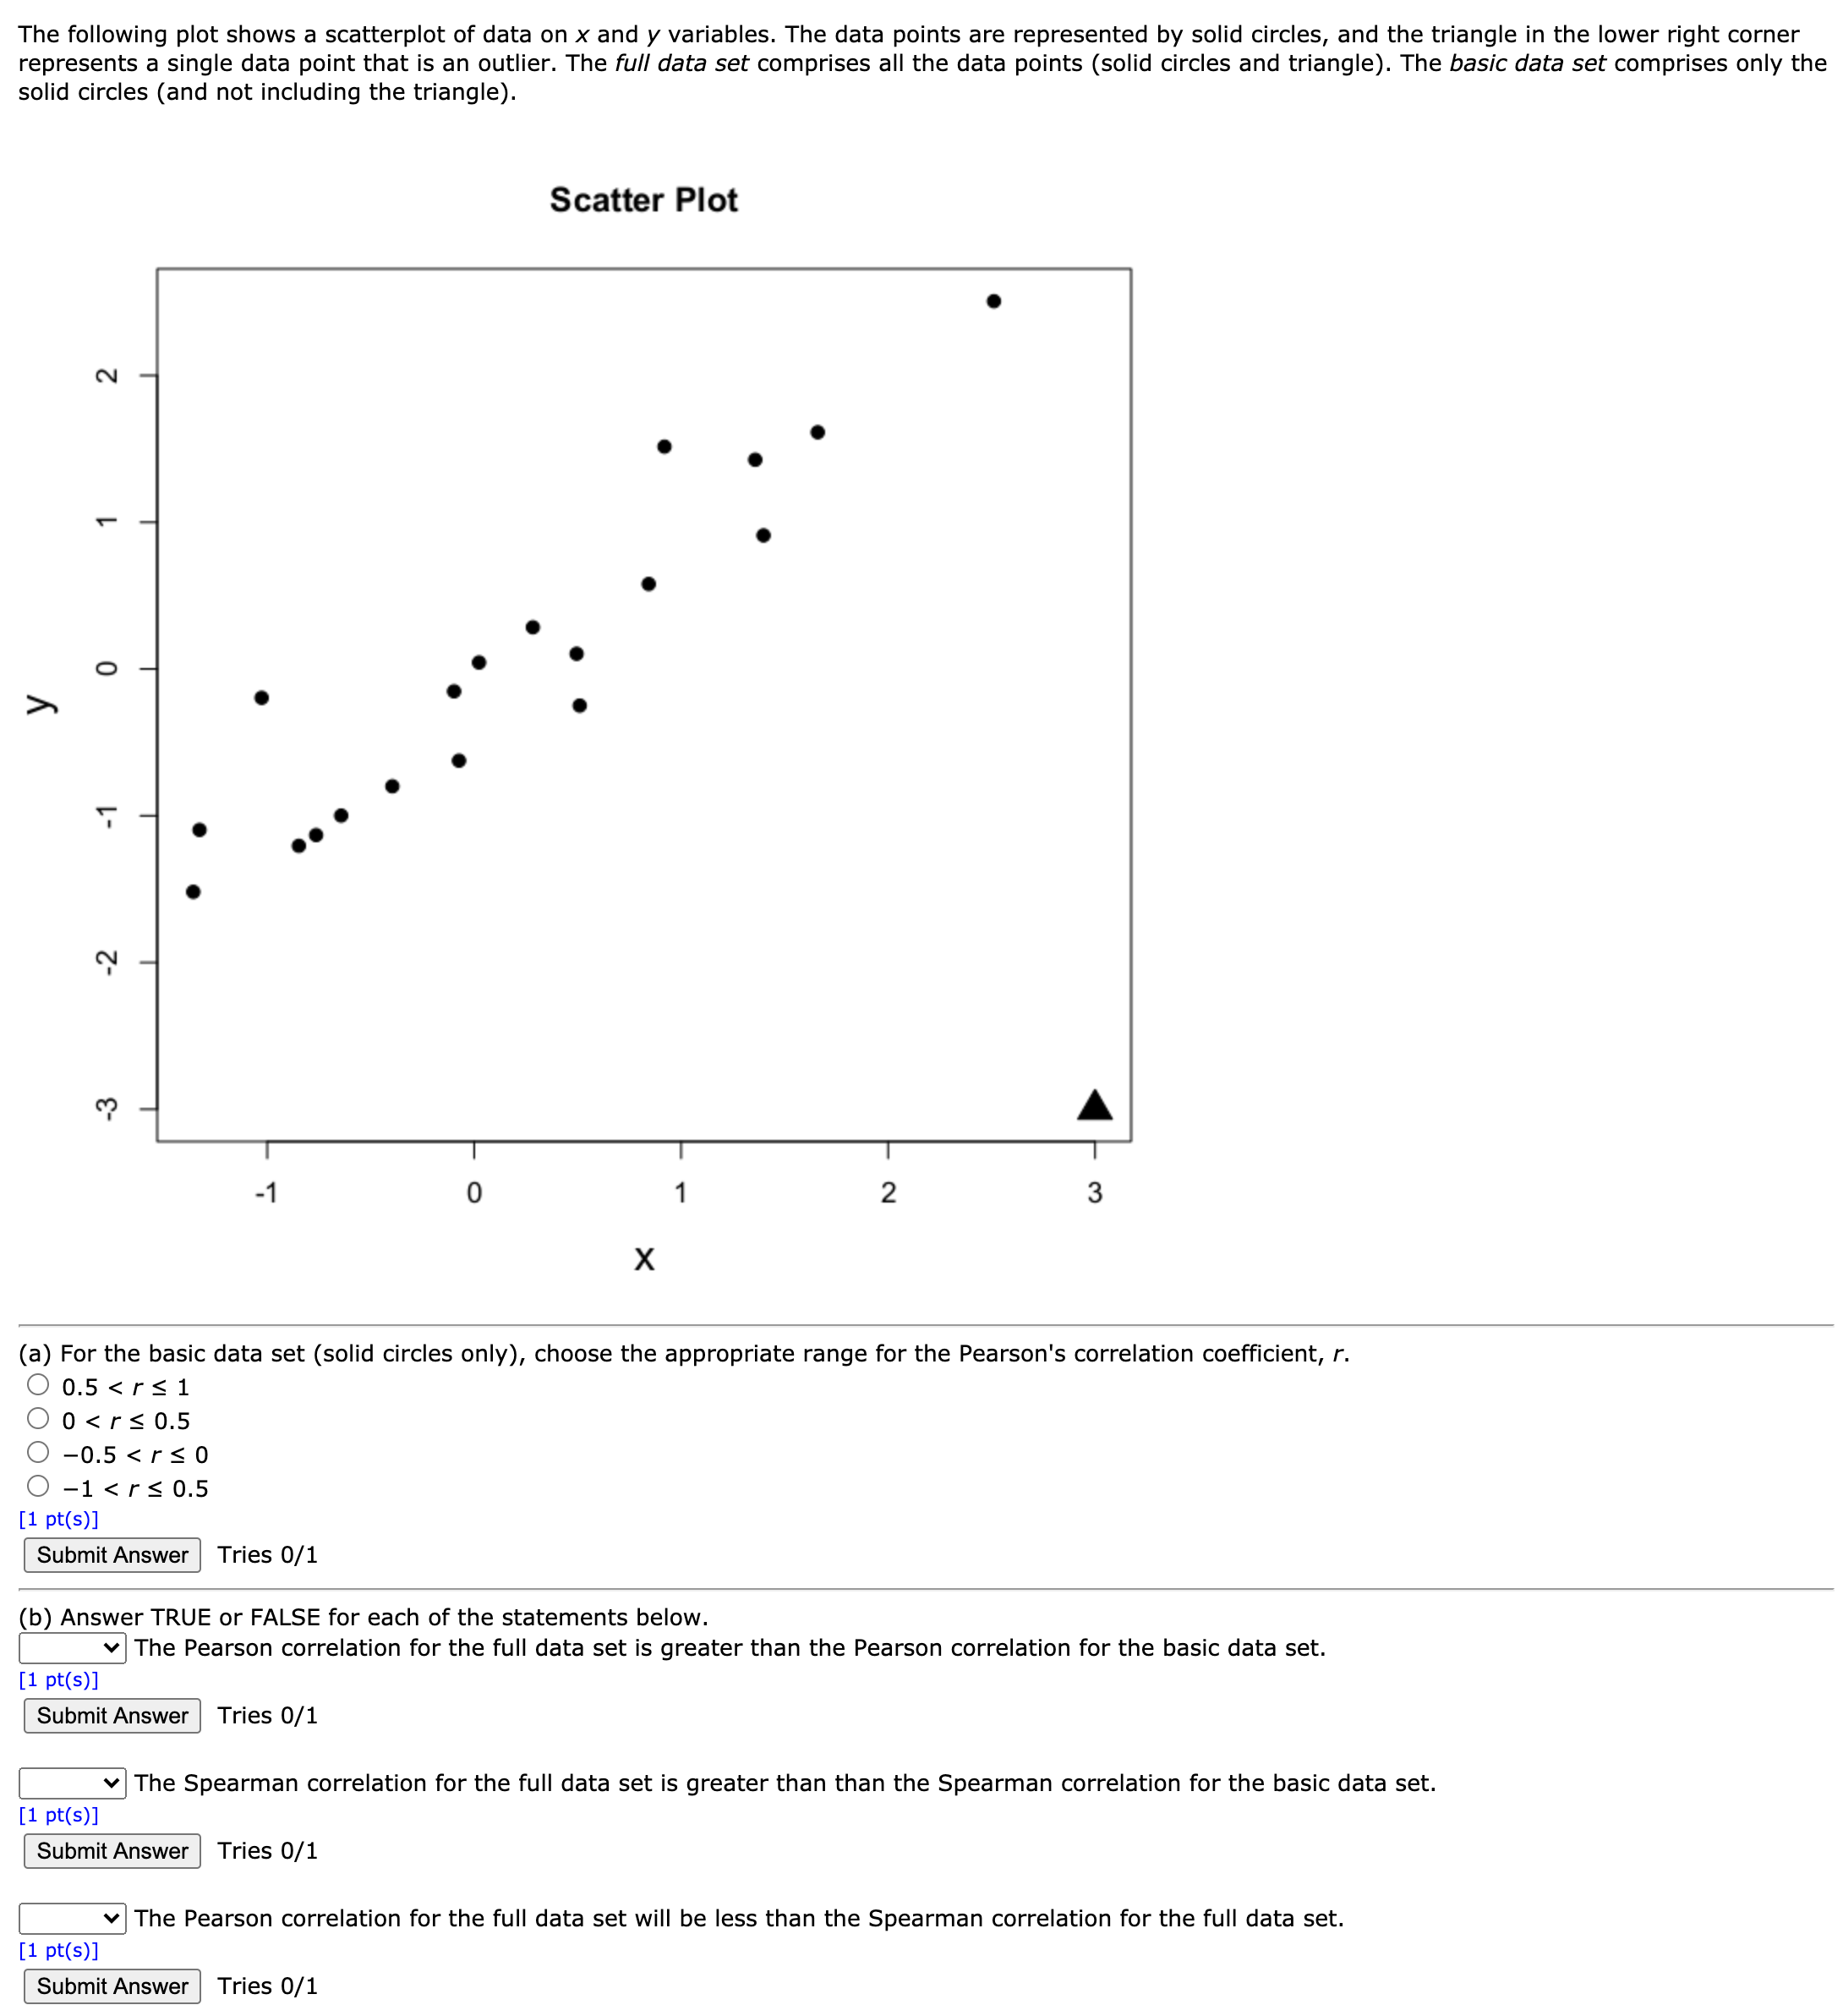
The following plot shows a scatterplot of data on X and y variables. The data points are represented by solid circles, and the triangle in the lower right corner represents a single data point that is an outlier. The full data set comprises all the data points (solid circles and triangle). The basic data set comprises only the solid circles (and not including the triangle). Scatter Plot X (a) For the basic data set (solid circles only), choose the appropriate range for the Pearson's correlation coefcient, r. O 0.5
Step by Step Solution
There are 3 Steps involved in it
1 Expert Approved Answer
Step: 1 Unlock

Question Has Been Solved by an Expert!
Get step-by-step solutions from verified subject matter experts
Step: 2 Unlock
Step: 3 Unlock