

Question: The following plot shows the weighted average maturity of interest rate sensitive TL and FX assets and liabilities for Turkish banks. The statistics are
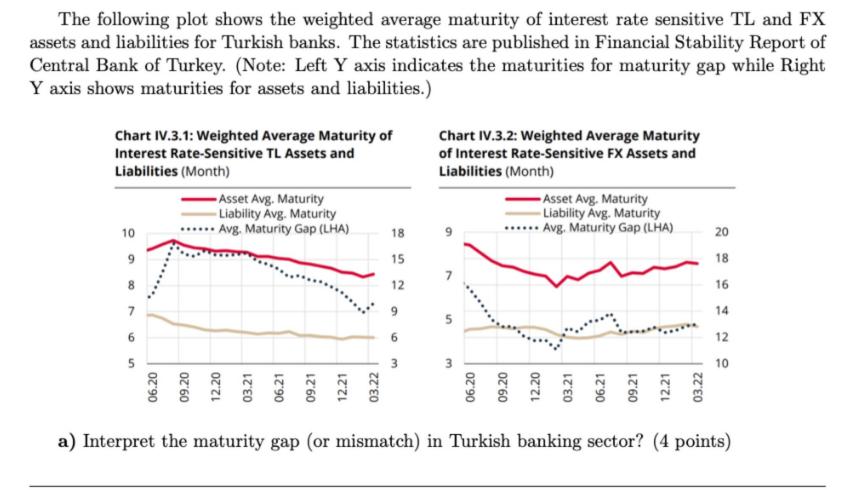
The following plot shows the weighted average maturity of interest rate sensitive TL and FX assets and liabilities for Turkish banks. The statistics are published in Financial Stability Report of Central Bank of Turkey. (Note: Left Y axis indicates the maturities for maturity gap while Right Y axis shows maturities for assets and liabilities.) Chart IV.3.1: Weighted Average Maturity of Interest Rate-Sensitive TL Assets and Liabilities (Month) 10 8 7 6 5 06.20 Asset Avg. Maturity - Liability Avg. Maturity Avg. Maturity Gap (LHA) 03.22 18 852 15 12 9 9 Chart IV.3.2: Weighted Average Maturity of Interest Rate-Sensitive FX Assets and Liabilities (Month) 5 06.20 09.20 Asset Avg. Maturity -Liability Avg. Maturity Avg. Maturity Gap (LHA) 12.20 03.21 03.22 20 18 16 14 12 10 a) Interpret the maturity gap (or mismatch) in Turkish banking sector? (4 points)
Step by Step Solution
3.37 Rating (153 Votes )
There are 3 Steps involved in it
The maturity gap or mismatch in banking refers to the difference in the maturity periods of a banks assets and liabilities It is an indication of the ... View full answer

Get step-by-step solutions from verified subject matter experts