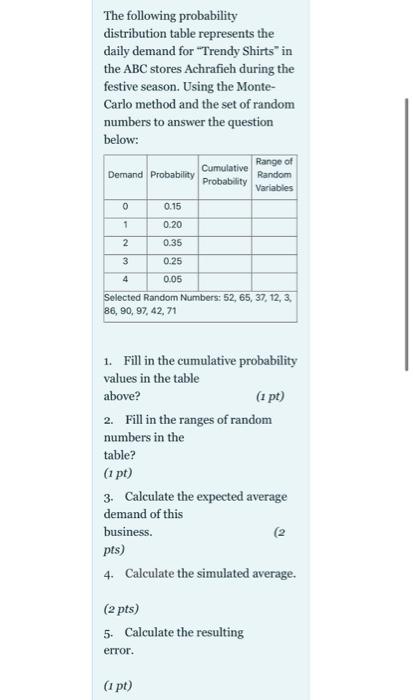
Question: The following probability distribution table represents the daily demand for Trendy Shirts in the ABC stores Achrafieh during the festive season. Using the Monte- Carlo

The following probability distribution table
The following probability distribution table represents the daily demand for "Trendy Shirts" in the ABC stores Achrafieh during the festive season. Using the Monte- Carlo method and the set of random numbers to answer the question below: Cumulative Demand Probability Probability Range of Random Variables 0 0.15 1 0.20 2 0.35 3 0.25 4 0.05 Selected Random Numbers: 52, 65, 37, 12, 3. 86, 90, 97, 42, 71 1. Fill in the cumulative probability values in the table above? (1 pt) 2. Fill in the ranges of random numbers in the table? (1 pt) 3. Calculate the expected average demand of this business. pts) 4. Calculate the simulated average. (2 pts) 5. Calculate the resulting error. (1 pt)

Step by Step Solution

There are 3 Steps involved in it

1 Expert Approved Answer
Step: 1 Unlock blur-text-image
Question Has Been Solved by an Expert!

Get step-by-step solutions from verified subject matter experts

Step: 2 Unlock
Step: 3 Unlock

Students Have Also Explored These Related General Management Questions!