

Question: The following problem has been giving me trouble. What do I do? Loading data from file Data on five golfers and five factors for each
The following problem has been giving me trouble. What do I do?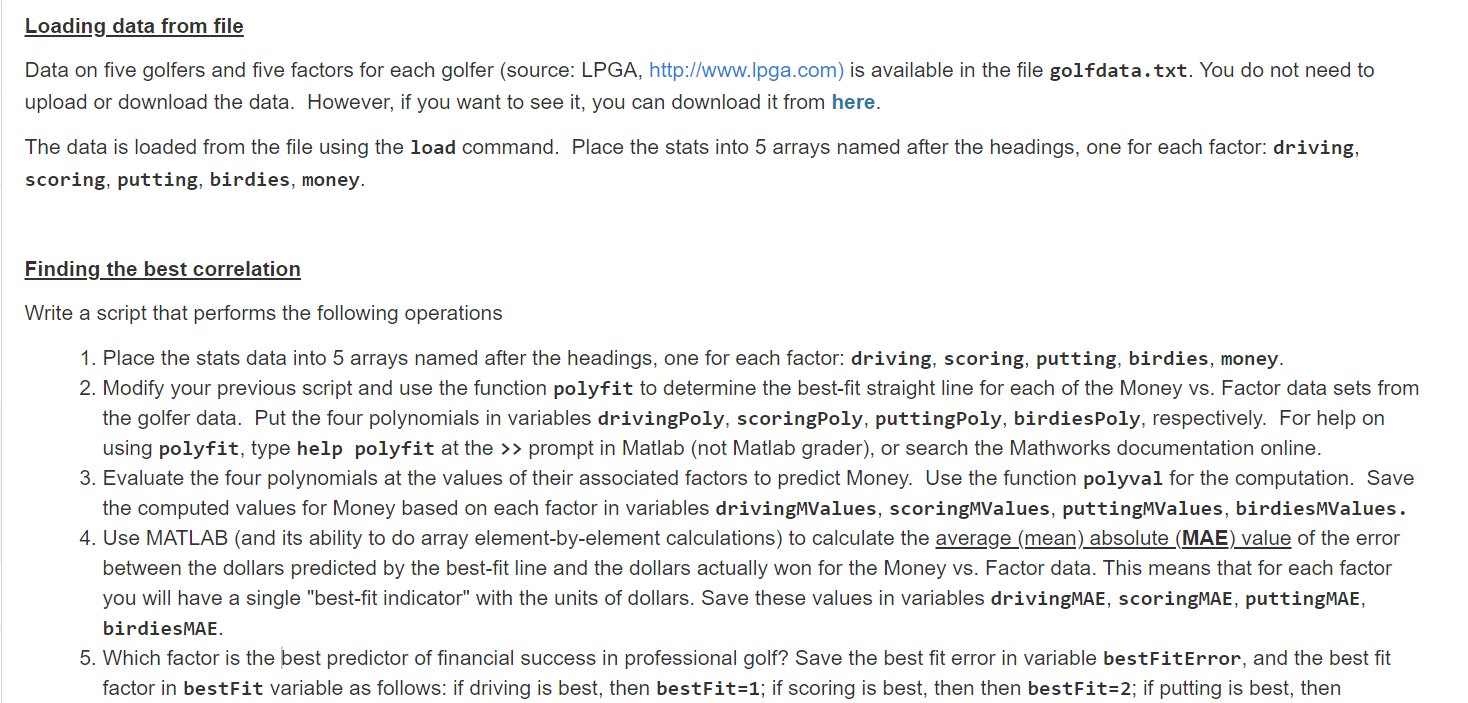
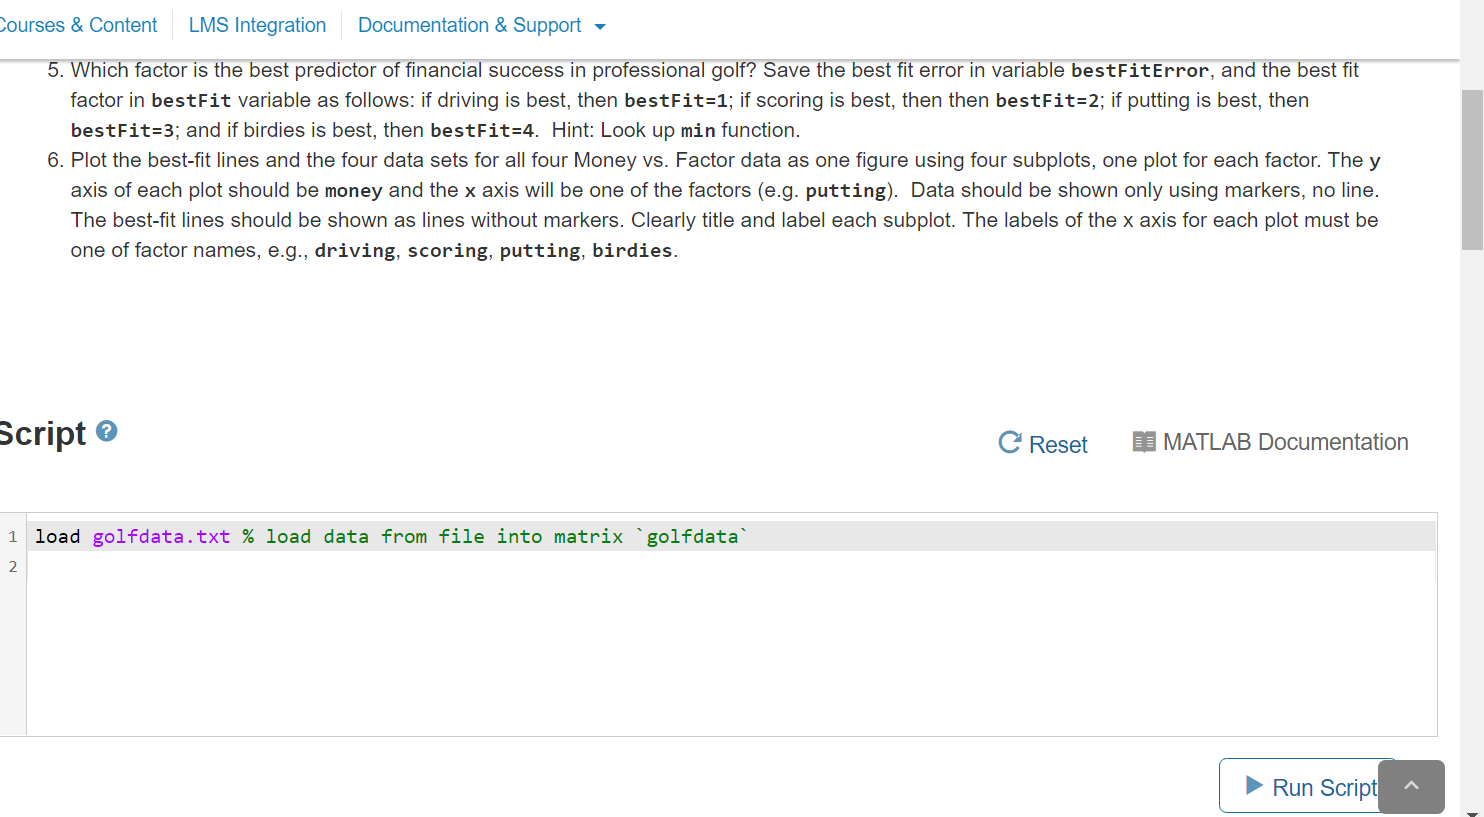
Loading data from file Data on five golfers and five factors for each golfer (source: LPGA, http://www.lpga.com) is available in the file golfdata.txt. You do not need to upload or download the data. However, if you want to see it, you can download it from here. The data is loaded from the file using the load command. Place the stats into 5 arrays named after the headings, one for each factor: driving, scoring, putting, birdies, money. Finding the best correlation Write a script that performs the following operations 1. Place the stats data into 5 arrays named after the headings, one for each factor: driving, scoring, putting, birdies, money. 2. Modify your previous script and use the function polyfit to determine the best-fit straight line for each of the Money vs. Factor data sets from the golfer data. Put the four polynomials in variables drivingPoly, scoringPoly, puttingPoly, birdiesPoly, respectively. For help on using polyfit, type help polyfit at the >> prompt in Matlab (not Matlab grader), or search the Mathworks documentation online. 3. Evaluate the four polynomials at the values of their associated factors to predict Money. Use the function polyval for the computation. Save the computed values for Money based on each factor in variables drivingMValues, scoringMValues, puttingMValues, birdiesMValues. 4. Use MATLAB (and its ability to do array element-by-element calculations) to calculate the average (mean) absolute (MAE) value of the error between the dollars predicted by the best-fit line and the dollars actually won for the Money vs. Factor data. This means that for each factor you will have a single "best-fit indicator" with the units of dollars. Save these values in variables drivingMAE, scoringMAE, puttingMAE, birdiesMAE 5. Which factor is the best predictor of financial success in professional golf? Save the best fit error in variable bestFitError, and the best fit factor in bestFit variable as follows: if driving is best, then bestFit=1; if scoring is best, then then bestFit=2; if putting is best, then Courses & Content LMS Integration Documentation & Support 5. Which factor is the best predictor of financial success in professional golf? Save the best fit error in variable bestFitError, and the best fit factor in bestFit variable as follows: if driving is best, then bestFit=1; if scoring is best, then then bestFit=2; if putting is best, then bestFit=3; and if birdies is best, then bestFit=4. Hint: Look up min function. 6. Plot the best-fit lines and the four data sets for all four Money vs. Factor data as one figure using four subplots, one plot for each factor. The y axis of each plot should be money and the x axis will be one of the factors (e.g. putting). Data should be shown only using markers, no line. The best-fit lines should be shown as lines without markers. Clearly title and label each subplot. The labels of the x axis for each plot must be one of factor names, e.g., driving, scoring, putting, birdies. Script C Reset MATLAB Documentation 1 load golfdata.txt % load data from file into matrix golfdata 2 Run Script Loading data from file Data on five golfers and five factors for each golfer (source: LPGA, http://www.lpga.com) is available in the file golfdata.txt. You do not need to upload or download the data. However, if you want to see it, you can download it from here. The data is loaded from the file using the load command. Place the stats into 5 arrays named after the headings, one for each factor: driving, scoring, putting, birdies, money. Finding the best correlation Write a script that performs the following operations 1. Place the stats data into 5 arrays named after the headings, one for each factor: driving, scoring, putting, birdies, money. 2. Modify your previous script and use the function polyfit to determine the best-fit straight line for each of the Money vs. Factor data sets from the golfer data. Put the four polynomials in variables drivingPoly, scoringPoly, puttingPoly, birdiesPoly, respectively. For help on using polyfit, type help polyfit at the >> prompt in Matlab (not Matlab grader), or search the Mathworks documentation online. 3. Evaluate the four polynomials at the values of their associated factors to predict Money. Use the function polyval for the computation. Save the computed values for Money based on each factor in variables drivingMValues, scoringMValues, puttingMValues, birdiesMValues. 4. Use MATLAB (and its ability to do array element-by-element calculations) to calculate the average (mean) absolute (MAE) value of the error between the dollars predicted by the best-fit line and the dollars actually won for the Money vs. Factor data. This means that for each factor you will have a single "best-fit indicator" with the units of dollars. Save these values in variables drivingMAE, scoringMAE, puttingMAE, birdiesMAE 5. Which factor is the best predictor of financial success in professional golf? Save the best fit error in variable bestFitError, and the best fit factor in bestFit variable as follows: if driving is best, then bestFit=1; if scoring is best, then then bestFit=2; if putting is best, then Courses & Content LMS Integration Documentation & Support 5. Which factor is the best predictor of financial success in professional golf? Save the best fit error in variable bestFitError, and the best fit factor in bestFit variable as follows: if driving is best, then bestFit=1; if scoring is best, then then bestFit=2; if putting is best, then bestFit=3; and if birdies is best, then bestFit=4. Hint: Look up min function. 6. Plot the best-fit lines and the four data sets for all four Money vs. Factor data as one figure using four subplots, one plot for each factor. The y axis of each plot should be money and the x axis will be one of the factors (e.g. putting). Data should be shown only using markers, no line. The best-fit lines should be shown as lines without markers. Clearly title and label each subplot. The labels of the x axis for each plot must be one of factor names, e.g., driving, scoring, putting, birdies. Script C Reset MATLAB Documentation 1 load golfdata.txt % load data from file into matrix golfdata 2 Run Script
Step by Step Solution
There are 3 Steps involved in it

Get step-by-step solutions from verified subject matter experts