

Question: The following question, I got it wrong, please answers and explain it Interpret each residual plot using the appropriate descriptions . Identify all of the
The following question, I got it wrong, please answers and explain it

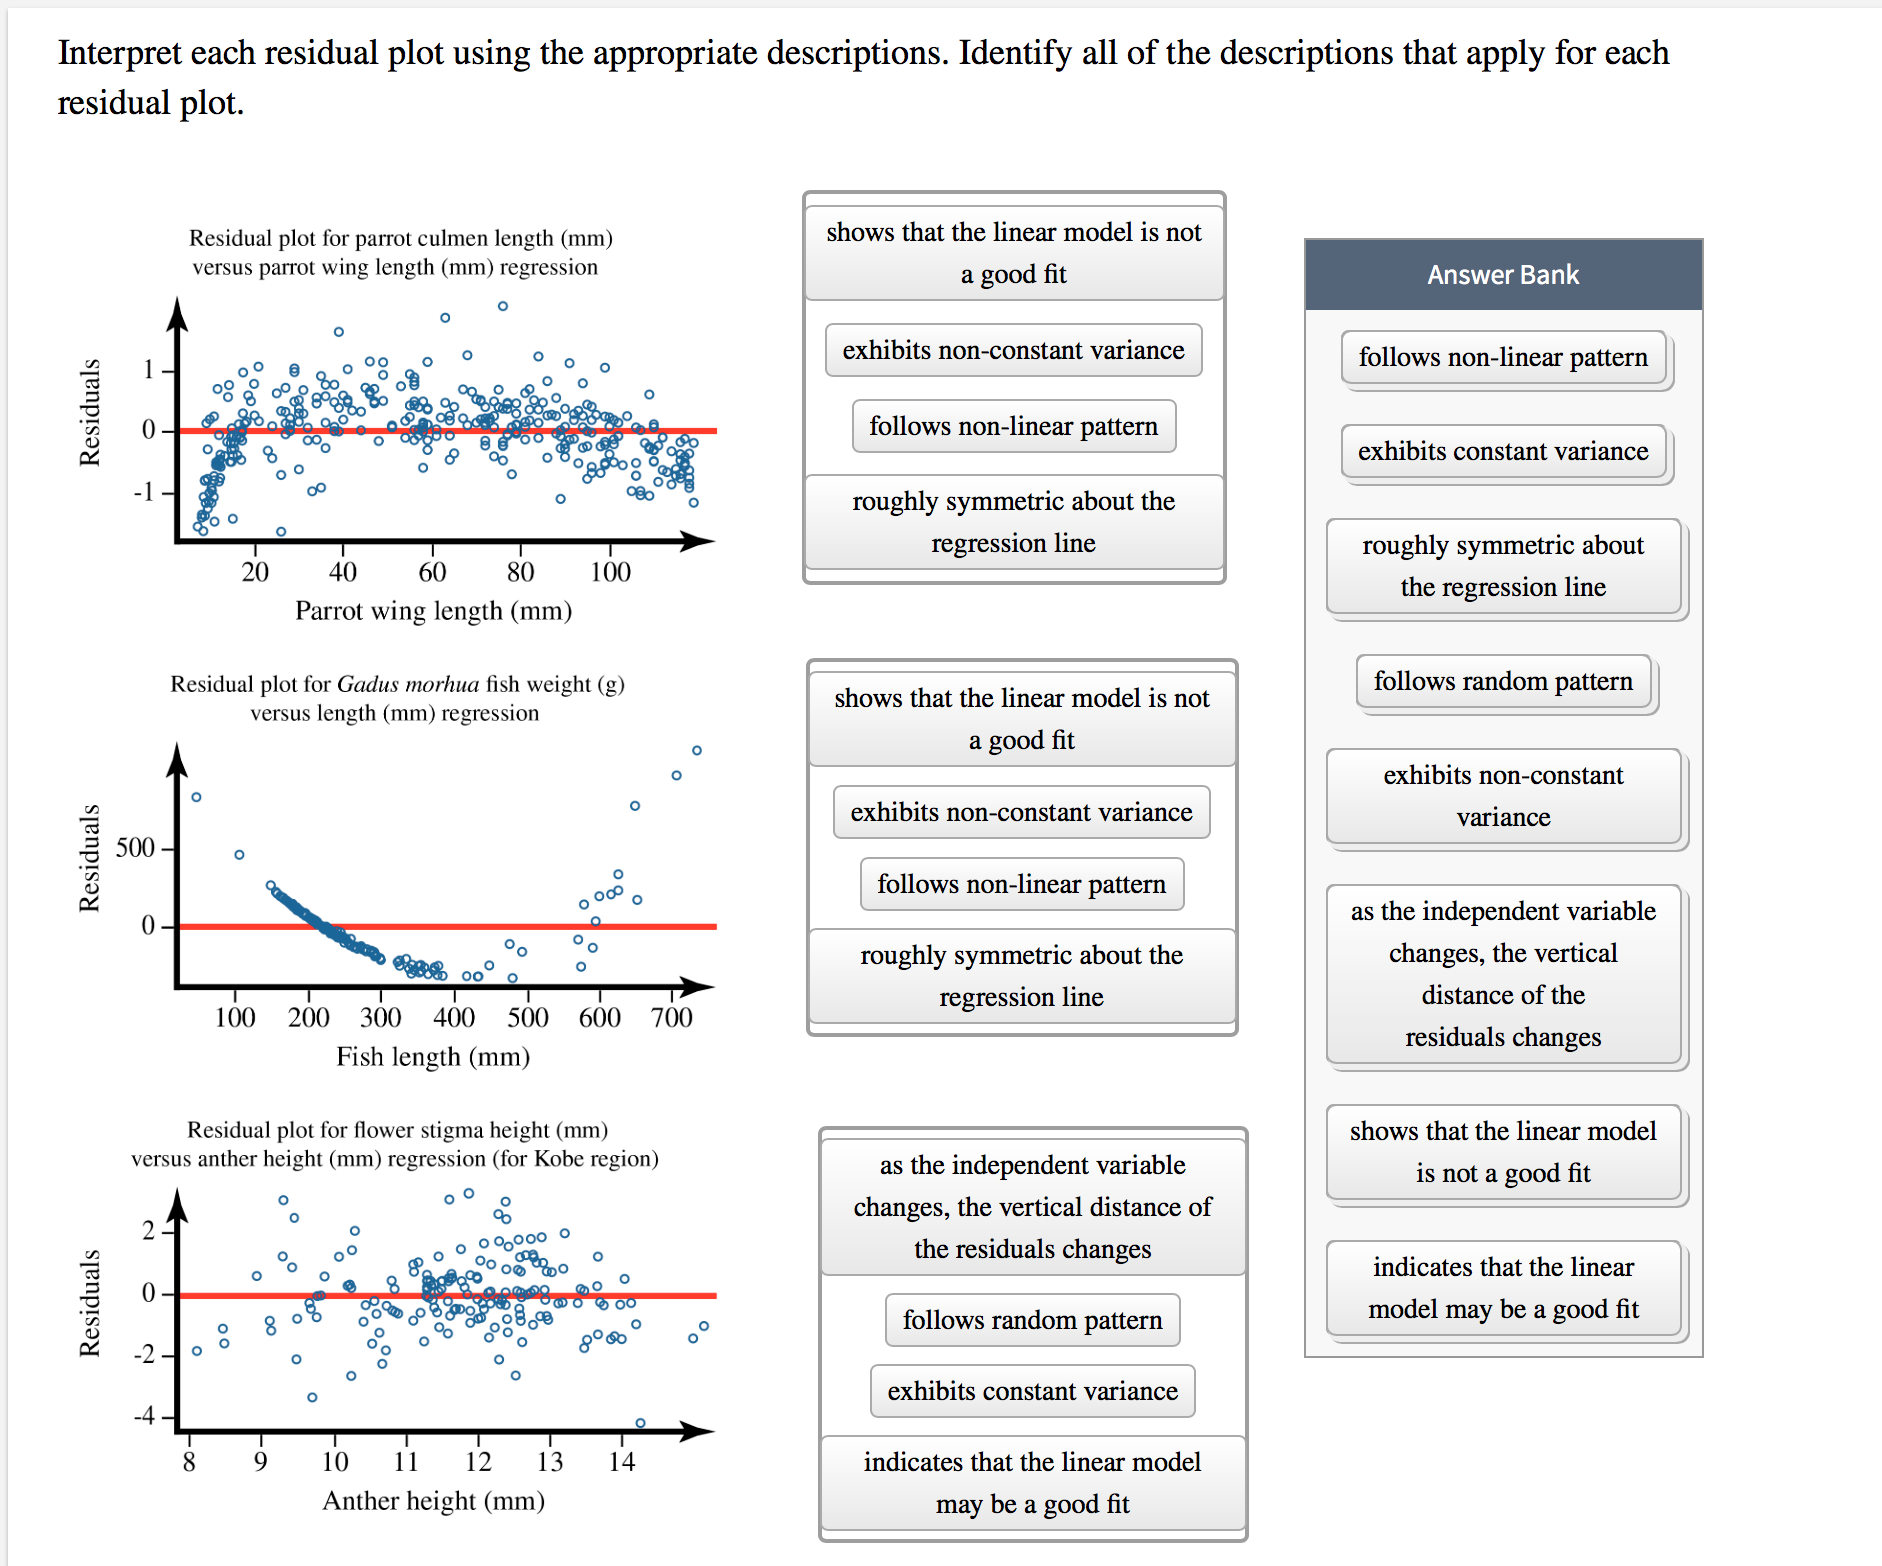
Interpret each residual plot using the appropriate descriptions . Identify all of the descriptions that apply for each residual plot . Residual plot for parrot culmen length ( mm ) shows that the linear model is not* versus parrot wing length ( mm ) regression* a good fit Answer SEN` O 2 0 exhibits non - constant variance 9 0 Q 8989 80` 08 ~ O follows non - linear pattern Residuals \\20 0 80 - 88 O - 00 0 08 0 80` follows non - linear pattern 80800 0 0 } exhibits constant variance - \\ roughly symmetric about the 40 60 100 regression line 80 roughly symmetric about 20 Parrot wing length ( mm ) the regression line Residual plot for Gadus morhua fish weight ( 8 ) follows random pattern versus length ( mm ) regression* shows that the linear model is not a good fit exhibits non - constant exhibits non - constant variance variance Residuals 500 0 000 follows non - linear pattern as the independent variable O roughly symmetric about the changes , the vertical 100 200 300 400 500 600 700 regression line distance of the Fish length ( mm ) residuals changes Residual plot for flower stigma height ( mm ) shows that the linear model versus anther height ( mm ) regression ( for Kobe region ) as the independent variable is not a good fit 0 0 changes , the vertical distance of 00 80 0 0 0 0,000 0` `9000 %0` the residuals changes indicates that the linear Residuals O 8 0% 00 0 0 08 0098 08 08\\ `600 0 0 0 model may be a good fit - L O C 8000 00 follows random pattern O \\O exhibits constant variance 8 9 10 1 1 12 14 indicates that the linear model Anther height ( mm )* may be a good fit
Step by Step Solution
There are 3 Steps involved in it

Get step-by-step solutions from verified subject matter experts