

Question: The following question needs to be solved graphically, explaining the economic and financial intuition of these graphs. Assume that you have two cash flows, one
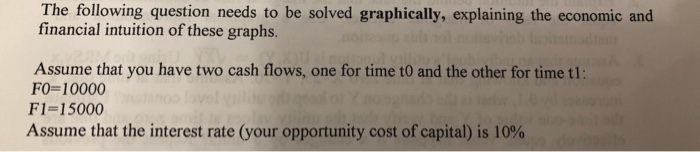
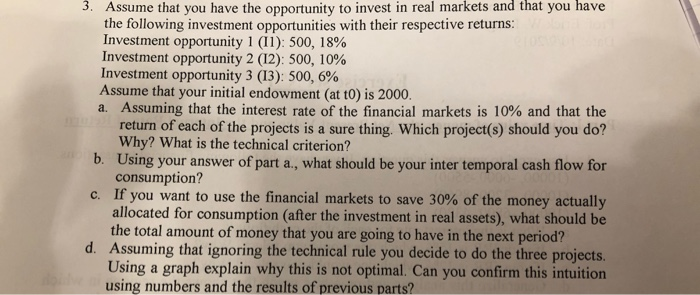
The following question needs to be solved graphically, explaining the economic and financial intuition of these graphs. Assume that you have two cash flows, one for time to and the other for time tl: F0=10000 F1=15000 Assume that the interest rate (your opportunity cost of capital) is 10% 3. Assume that you have the opportunity to invest in real markets and that you have the following investment opportunities with their respective returns Investment opportunity 1 (11): 500, 18% Investment opportunity 2 (12): 500, 10% Investment opportunity 3 (13): 500, 6% Assume that your initial endowment (at t0) is 2000. a. Assuming that the interest rate of the financial markets is 10% and that the return of each of the projects is a sure thing. Which project(s) should you do? Why? What is the technical criterion? b. Using your answer of part a., what should be your inter temporal cash flow for consumption? c. If you want to use the financial markets to save 30% of the money actually allocated for consumption (after the investment in real assets), what should be the total amount of money that you are going to have in the next period? d. Assuming that ignoring the technical rule you decide to do the three projects Using a graph explain why this is not optimal. Can you confirm this intuition using numbers and the results of previous parts? The following question needs to be solved graphically, explaining the economic and financial intuition of these graphs. Assume that you have two cash flows, one for time to and the other for time tl: F0=10000 F1=15000 Assume that the interest rate (your opportunity cost of capital) is 10% 3. Assume that you have the opportunity to invest in real markets and that you have the following investment opportunities with their respective returns Investment opportunity 1 (11): 500, 18% Investment opportunity 2 (12): 500, 10% Investment opportunity 3 (13): 500, 6% Assume that your initial endowment (at t0) is 2000. a. Assuming that the interest rate of the financial markets is 10% and that the return of each of the projects is a sure thing. Which project(s) should you do? Why? What is the technical criterion? b. Using your answer of part a., what should be your inter temporal cash flow for consumption? c. If you want to use the financial markets to save 30% of the money actually allocated for consumption (after the investment in real assets), what should be the total amount of money that you are going to have in the next period? d. Assuming that ignoring the technical rule you decide to do the three projects Using a graph explain why this is not optimal. Can you confirm this intuition using numbers and the results of previous parts
Step by Step Solution
There are 3 Steps involved in it

Get step-by-step solutions from verified subject matter experts