

Question: The following sample data has been provided for Temperature and Soft Drink Sales {in SlODD's of dollars} for 5 days. Included is the 96 change
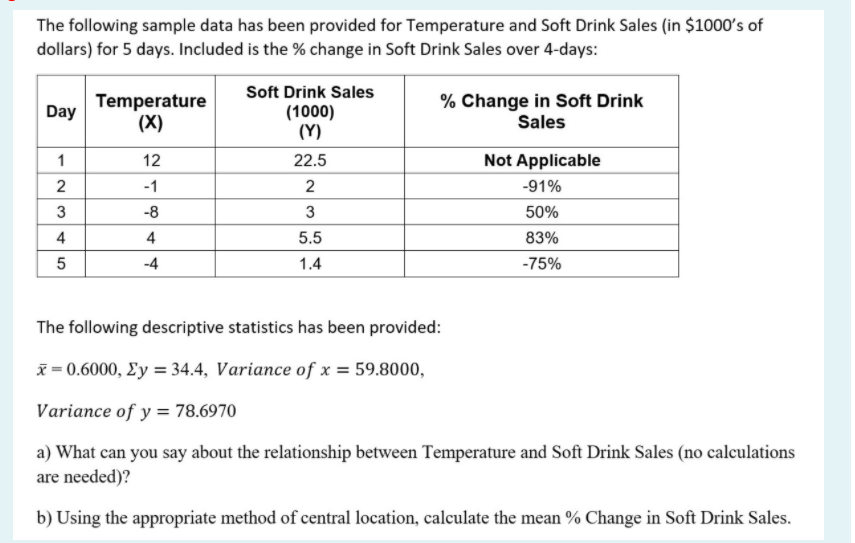
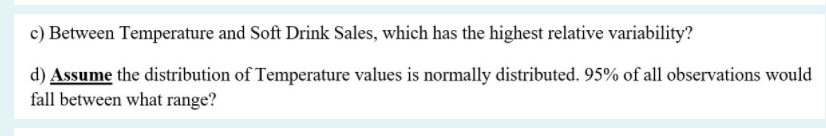


The following sample data has been provided for Temperature and Soft Drink Sales {in SlODD's of dollars} for 5 days. Included is the 96 change in Soft Drink Sales over til-days: Salt 51:33:?\" it. Change in Soft Drink {Vi Sales Not Applicable -91 'ii: 50% 83% #596 The following descriptive statistics has been provided: 1? - 0.6000, 2y = 34.4, Variance of x = 59.3000, Variance of y = 'i'ii'i a} What can you 5a}.r about the relationship between Temperature and Soft Drink Sales (no calculations are needed)? b) Using the appropriate method of central location, calculate the mean 9/ Change in Soft Drink Sales. c) Between Temperature and Soft Drink Sales, which has the highest relative variability? d) Assume the distribution of Temperature values is normally distributed. 95% of all observations would fall between what range
Step by Step Solution
There are 3 Steps involved in it

Get step-by-step solutions from verified subject matter experts