

Question: The following scatterplot depicts the relationship between midterm and final exam grades for 96 students in a corporate finance course. The correlation value is 0.76.
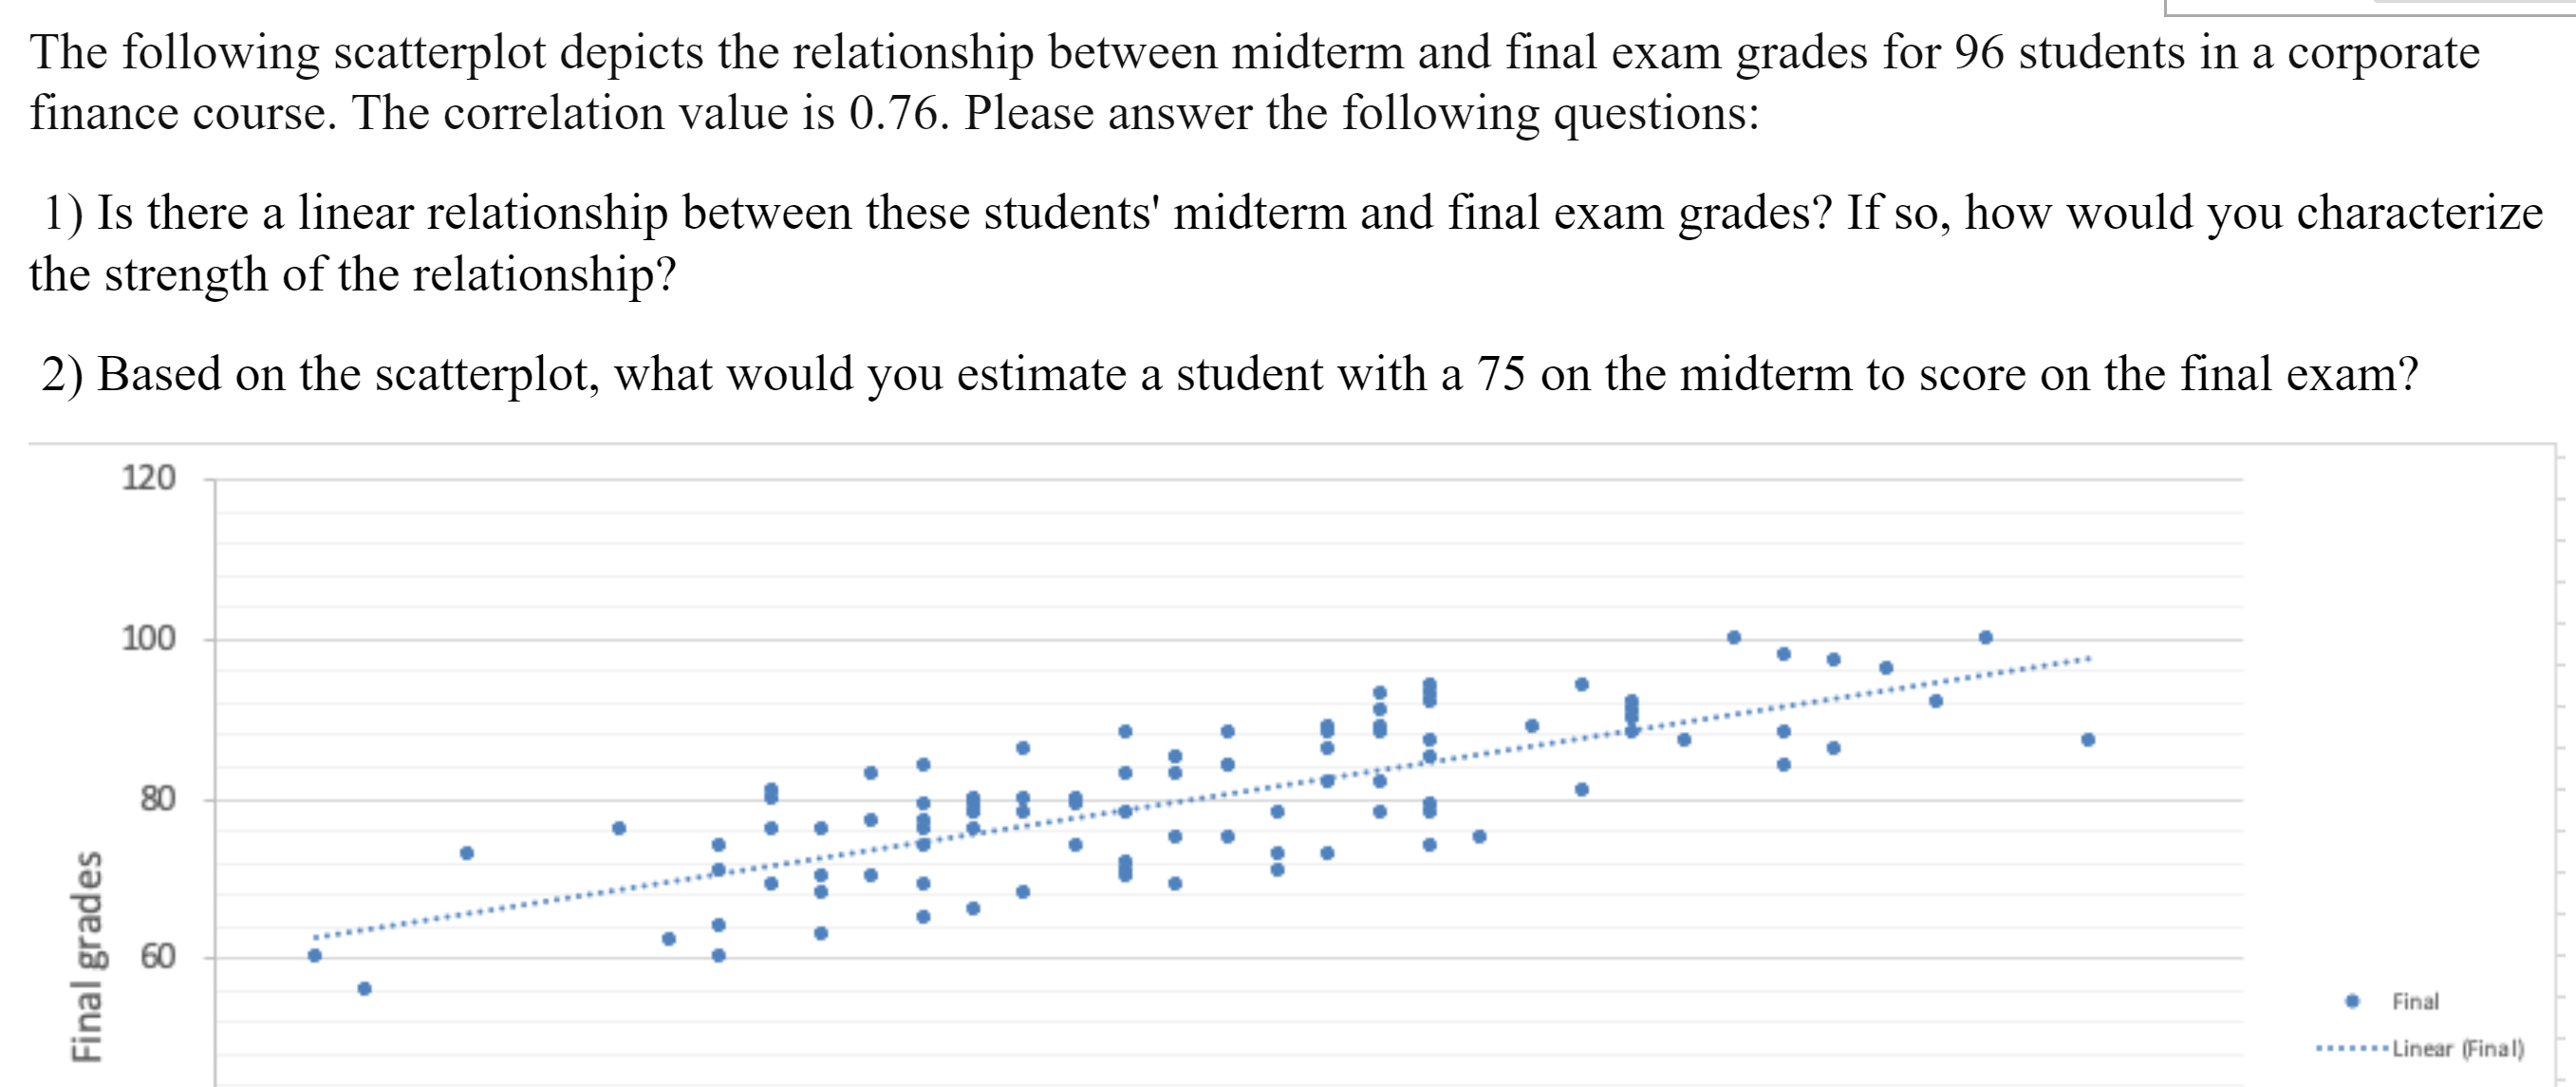
The following scatterplot depicts the relationship between midterm and final exam grades for 96 students in a corporate finance course. The correlation value is 0.76. Please answer the following questions: 1) Is there a linear relationship between these students' midterm and final exam grades? If so, how would you characterize the strength of the relationship? 2) Based on the scatterplot, what would you estimate a student with a 75 on the midterm to score on the final exam? 120 100 ......... 80 ..4........... Final grades 60 Final . ...= = = Linear (Final)
Step by Step Solution
There are 3 Steps involved in it
1 Expert Approved Answer
Step: 1 Unlock

Question Has Been Solved by an Expert!
Get step-by-step solutions from verified subject matter experts
Step: 2 Unlock
Step: 3 Unlock