

Question: The following scatterplot gives the U.S. wind energy production in billions KWhrs since 1990. U.S. Wind Energy Production (billion KWhrs) 350 300 y = 1.3434e0.1996x
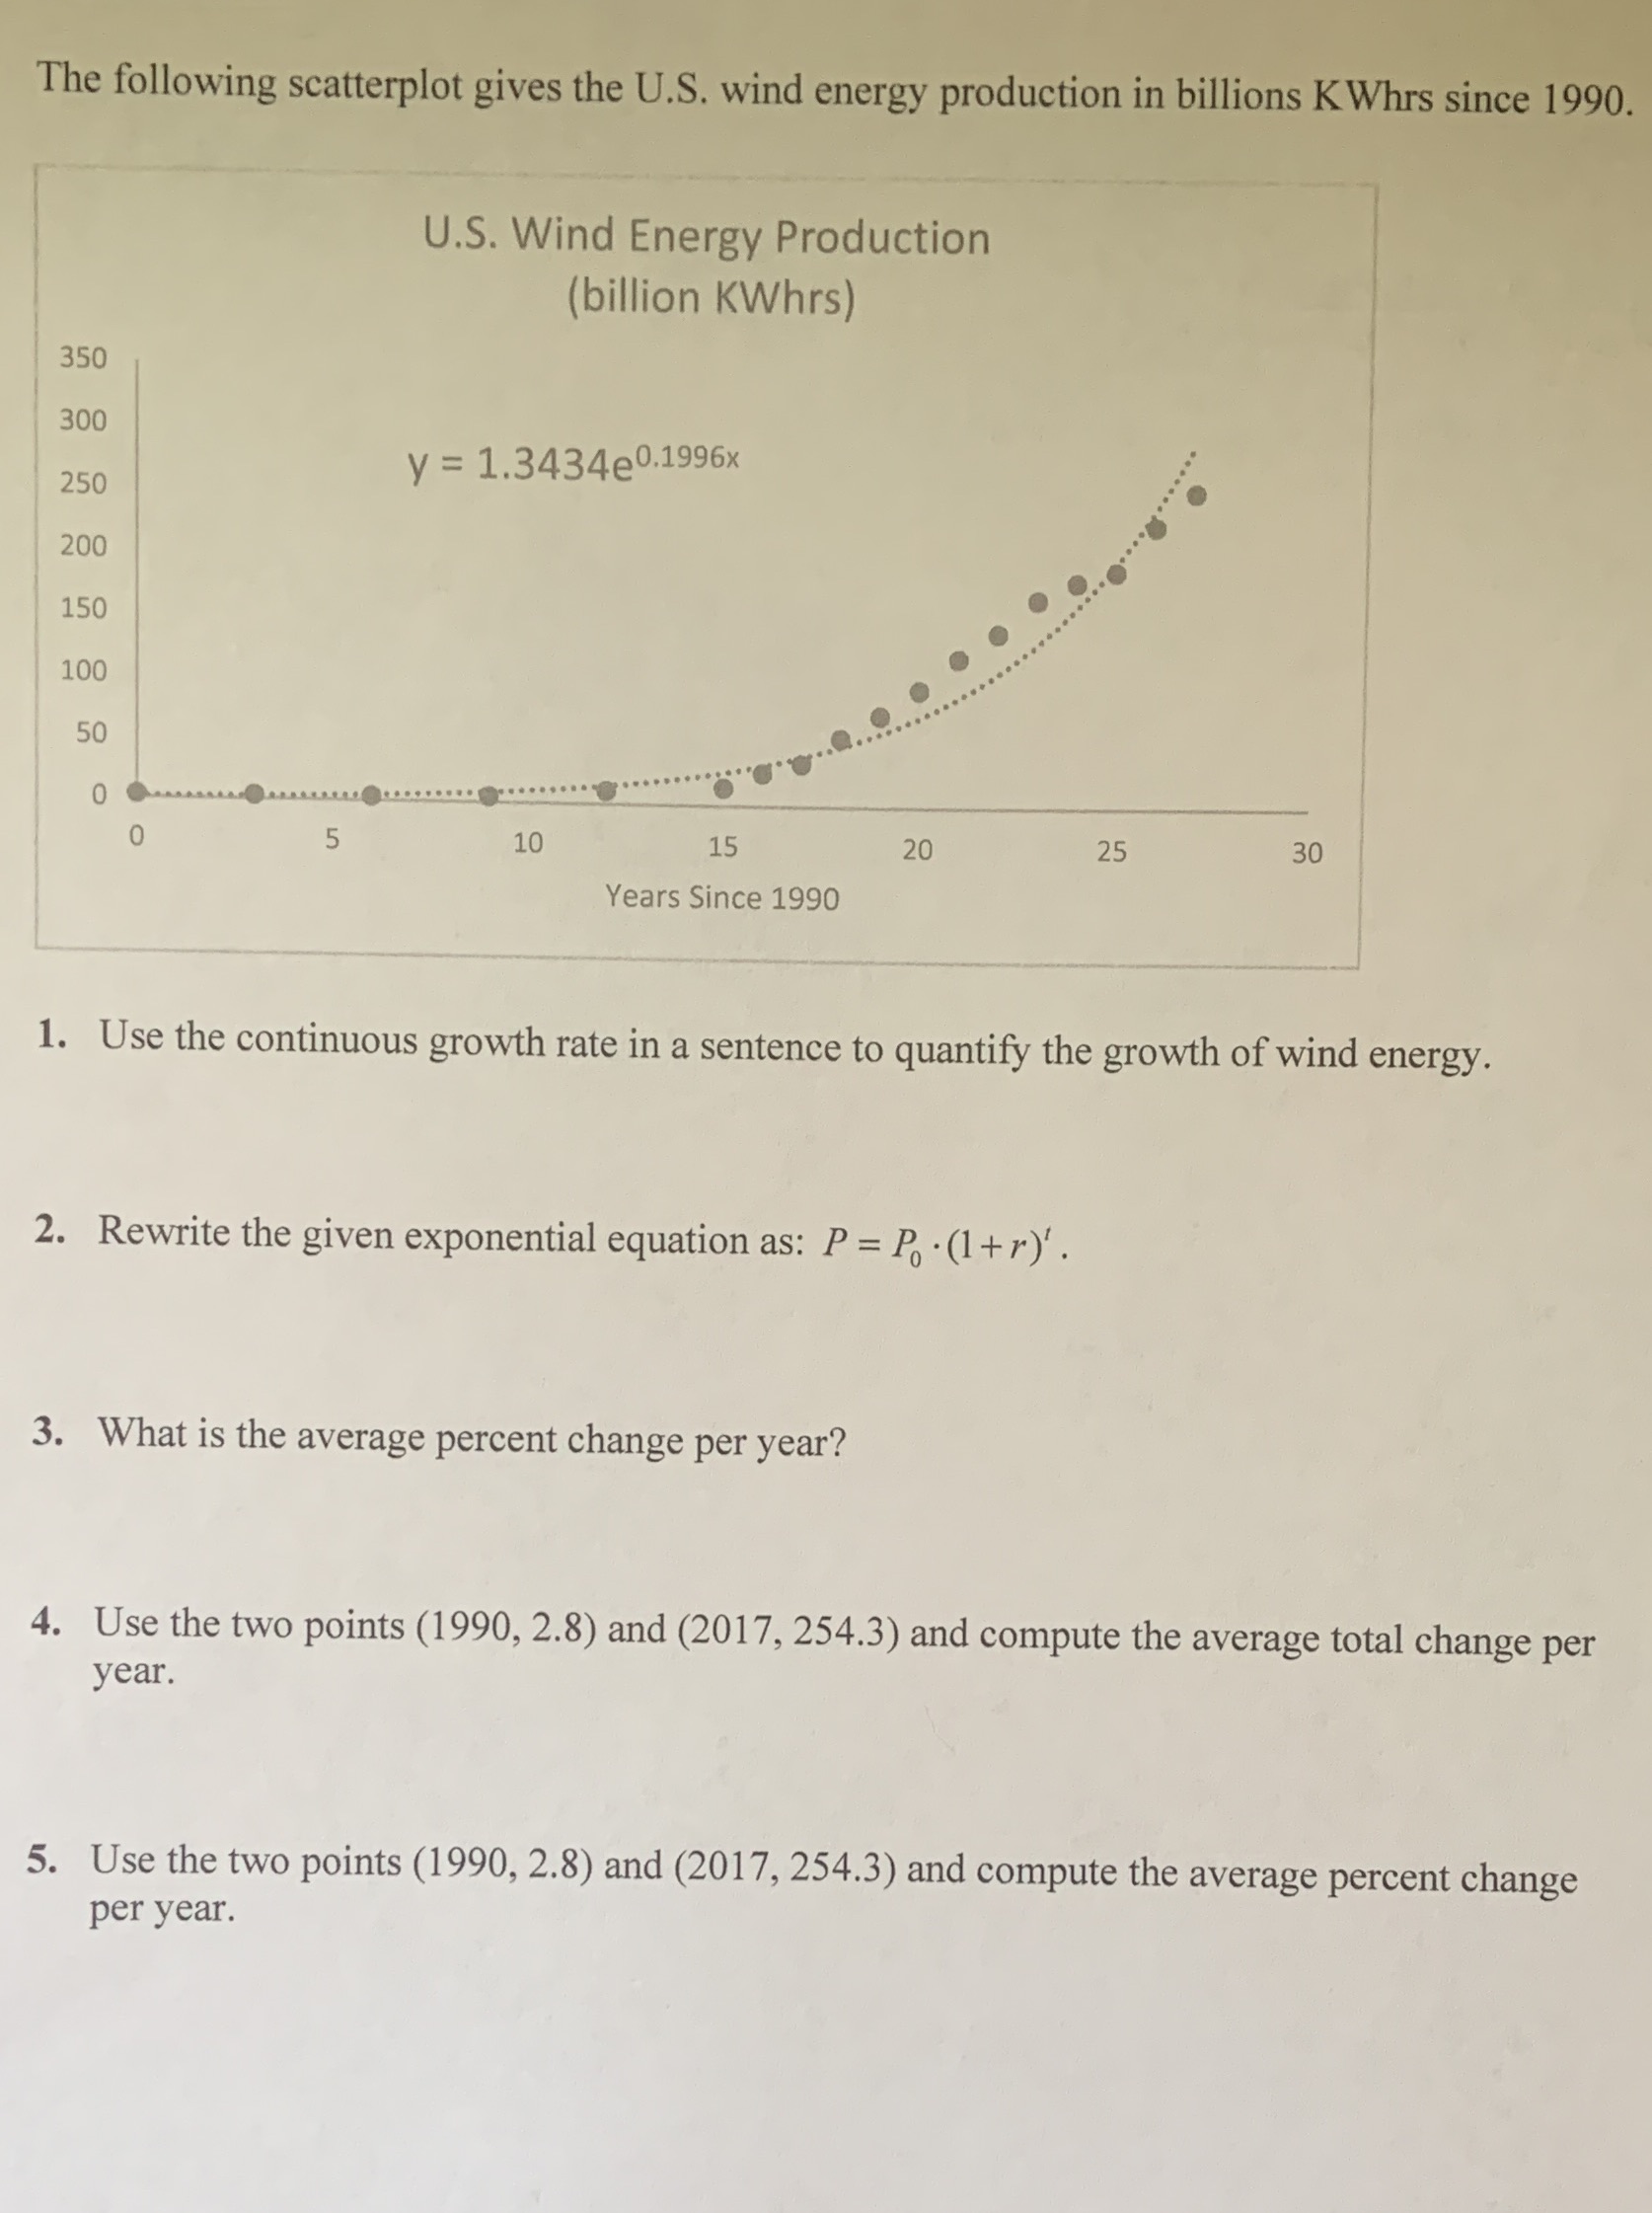
The following scatterplot gives the U.S. wind energy production in billions KWhrs since 1990. U.S. Wind Energy Production (billion KWhrs) 350 300 y = 1.3434e0.1996x 250 . ...... 200 150 100 50 5 10 15 20 25 30 Years Since 1990 1. Use the continuous growth rate in a sentence to quantify the growth of wind energy. 2. Rewrite the given exponential equation as: P = P . (1+r)'. 3. What is the average percent change per year? 4. Use the two points (1990, 2.8) and (2017, 254.3) and compute the average total change per year. 5. Use the two points (1990, 2.8) and (2017, 254.3) and compute the average percent change per year
Step by Step Solution
There are 3 Steps involved in it
1 Expert Approved Answer
Step: 1 Unlock

Question Has Been Solved by an Expert!
Get step-by-step solutions from verified subject matter experts
Step: 2 Unlock
Step: 3 Unlock