

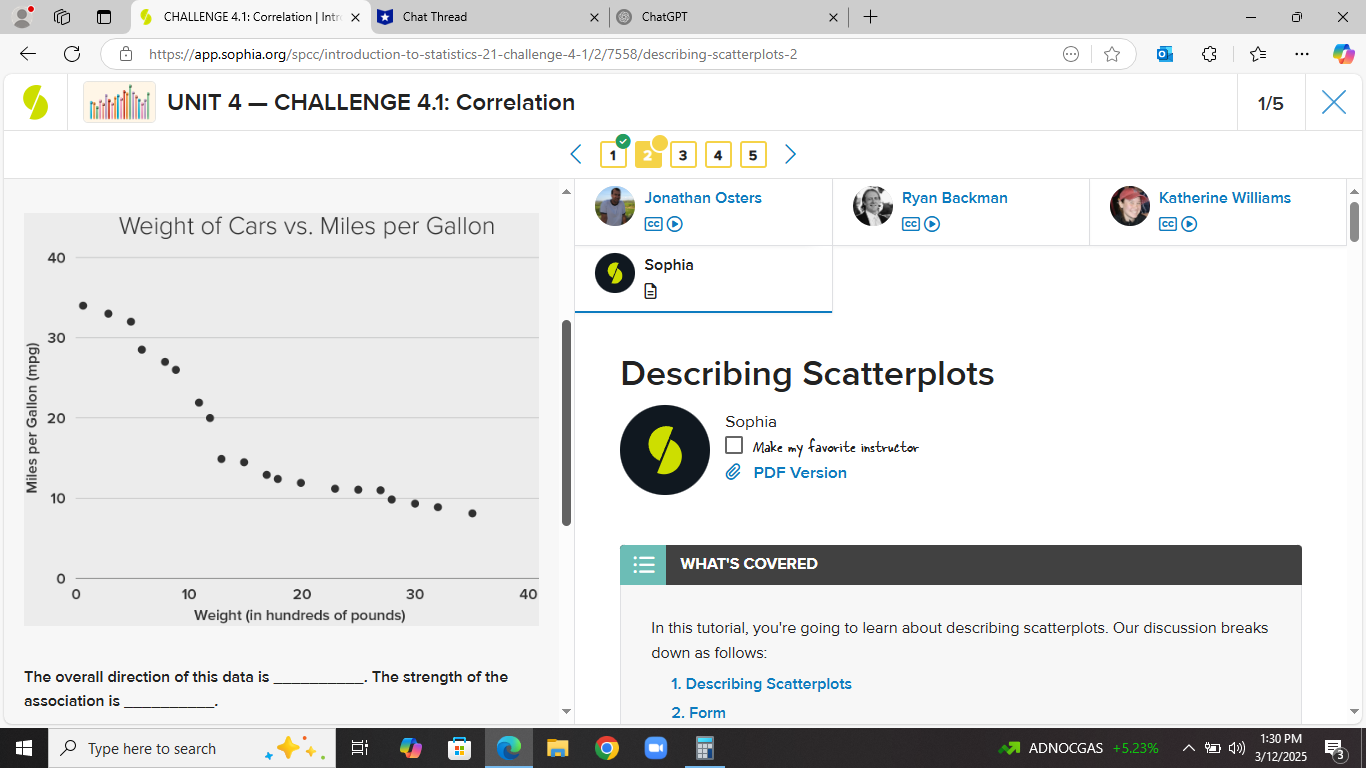
Question: The following scatterplot shows the 20 top-selling cars with their weight on the horizontal axis and their miles per gallon (mpg) on the vertical axis.
The following scatterplot shows the 20 top-selling cars with their weight on the horizontal axis and their miles per gallon (mpg) on the vertical axis. The overall direction of this data is __________. The strength of the association is __________. A.) negative; weak B.) negative; strong C.) positive; weak D.) positive; strong
 CHALLENGE 4.1: Correlation | Intro X * Chat Thread x ChatGPT X + X G https://app.sophia.org/spcc/introduction-to-statistics-21-challenge-4-1/2/7558/describing-scatterplots-2 o . .. UNIT 4 - CHALLENGE 4.1: Correlation 1/5 X 2 3 4 5 Jonathan Osters Ryan Backman Katherine Williams Weight of Cars vs. Miles per Gallon 40 Sophia 30 Describing Scatterplots Miles per Gallon (mpg) 20 Sophia Make my favorite instructor @ PDF Version 10 WHAT'S COVERED 0 10 20 30 40 Weight (in hundreds of pounds) In this tutorial, you're going to learn about describing scatterplots. Our discussion breaks down as follows: The overall direction of this data is The strength of the 1. Describing Scatterplots association is 2. Form H Type here to search 9 1:30 PM ADNOCGAS +5.23% 3/12/2025
Step by Step Solution
There are 3 Steps involved in it
1 Expert Approved Answer
Step: 1 Unlock

Question Has Been Solved by an Expert!
Get step-by-step solutions from verified subject matter experts
Step: 2 Unlock
Step: 3 Unlock