

Question: The following scatterplot shows the selling price (according to Kelly's Blue Book) of 31 Toyota Camry's as a function of their mileage. a) What does
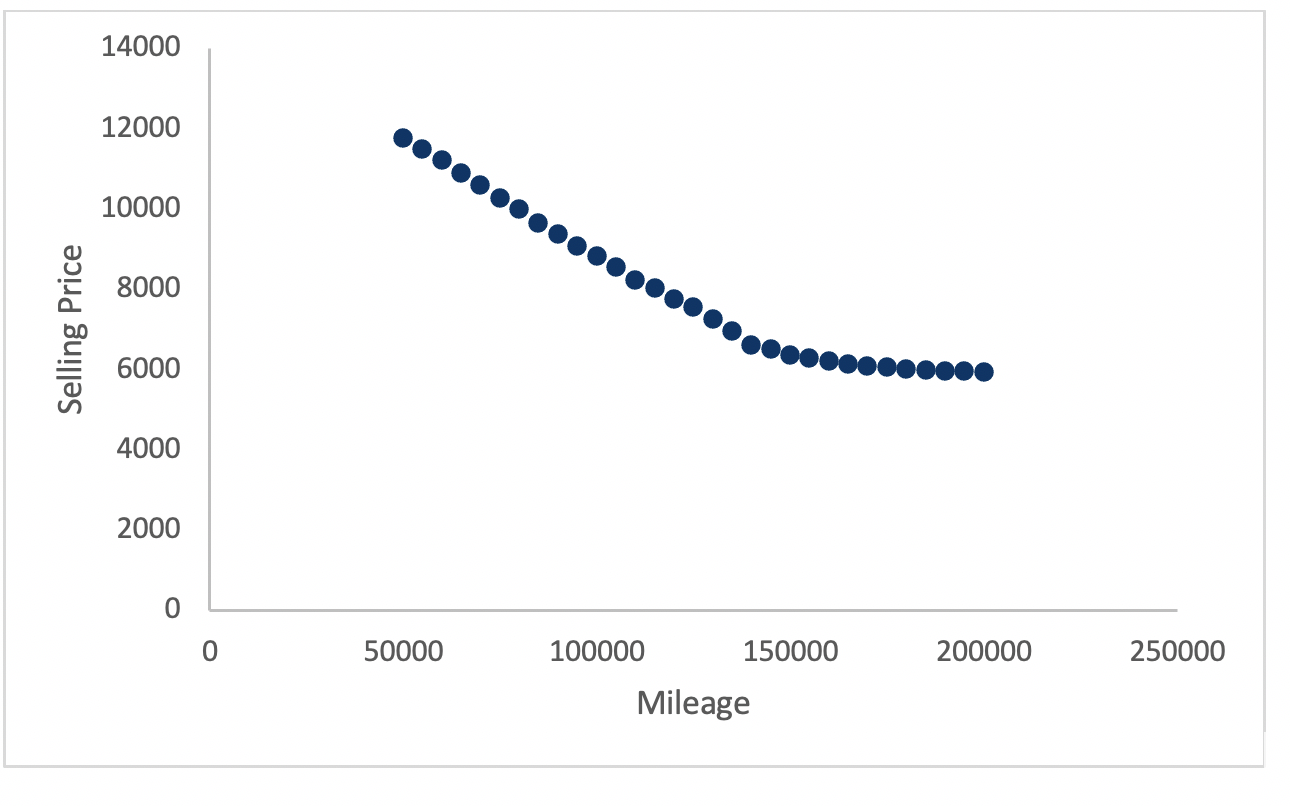
The following scatterplot shows the selling price (according to Kelly's Blue Book) of 31 Toyota Camry's as a function of their mileage.
a)What does this scatterplot tell you?
The result of a simple linear regression analysis with "Selling Price" as the dependent and "Mileage" as the independent variable are given below:
a)Is there a statistically significant relationship between selling price and mileage? Explain your answer.
b)How would the selling price change for every additional 10,000 miles of a Camry? Find a 95% confidence interval for that change.
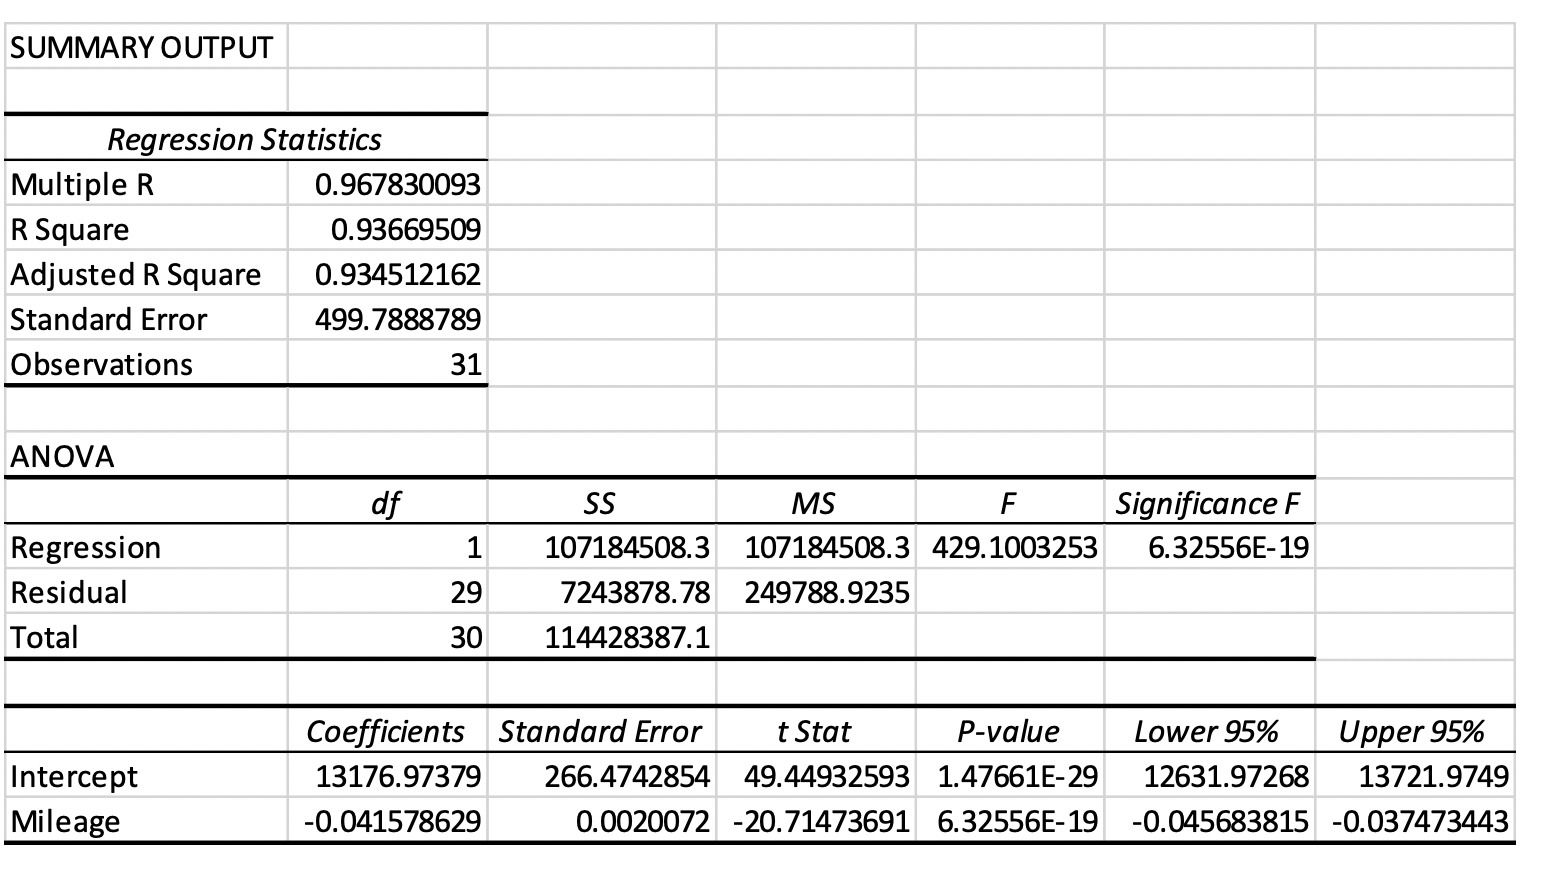
\fSUMMARY OUTPUT Regression Statistics Multiple R 0.967830093 R Square 0.93669509 Adjusted R Square 0.934512162 Standard Error 499.7888789 Observations 31 ANOVA df SS MS F Significance F Regression 1 107184508.3 107184508.3 429.1003253 6.32556E-19 Residual 29 7243878.78 249788.9235 Total 30 114428387.1 Coefficients Standard Error t Stat P-value Lower 95% Upper 95% Intercept 13176.97379 266.4742854 49.44932593 1.47661E-29 12631.97268 13721.9749 Mileage -0.041578629 0.0020072 -20.71473691 6.32556E-19 -0.045683815 -0.037473443
Step by Step Solution
There are 3 Steps involved in it

Get step-by-step solutions from verified subject matter experts