

Question: The following stem-and-leaf plot represents the test scores for 26 students in a class on their most recent test. Use the data provided to
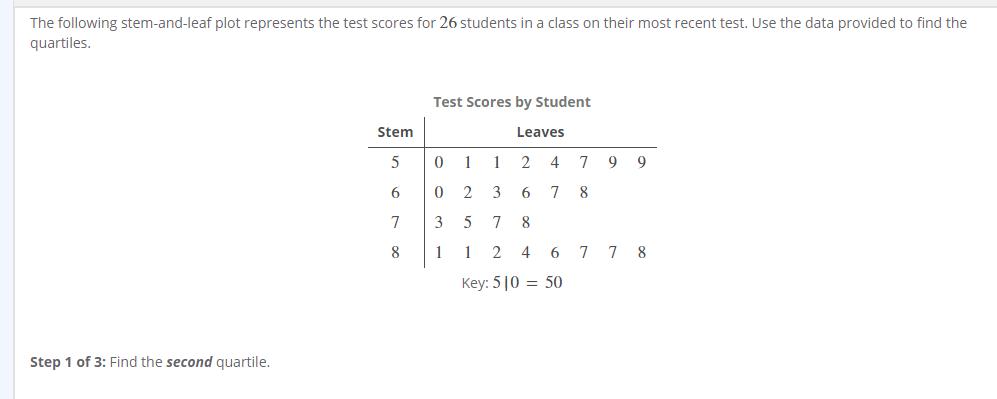
The following stem-and-leaf plot represents the test scores for 26 students in a class on their most recent test. Use the data provided to find the quartiles. Step 1 of 3: Find the second quartile. Stem 5 6 7 8 Test Scores by Student Leaves 0 1 12 4 7 0 2 3 6 7 8 3578 1 9 9 1 2 4 6 778 Key: 510 50 Step 2 of 3: Find the first quartile. Answer (How to Enter) 2 Points Step 3 of 3: Find the third quartile. Answer (How to Enter) 2 Points
Step by Step Solution
★★★★★
3.53 Rating (153 Votes )
There are 3 Steps involved in it
1 Expert Approved Answer
Step: 1 Unlock

Question Has Been Solved by an Expert!
Get step-by-step solutions from verified subject matter experts
Step: 2 Unlock
Step: 3 Unlock