

Question: The following straight-line graph summarizes the data for world cigarette production over the years 1990-1993. Specify At and AN for the period 1990-1993. (Include units


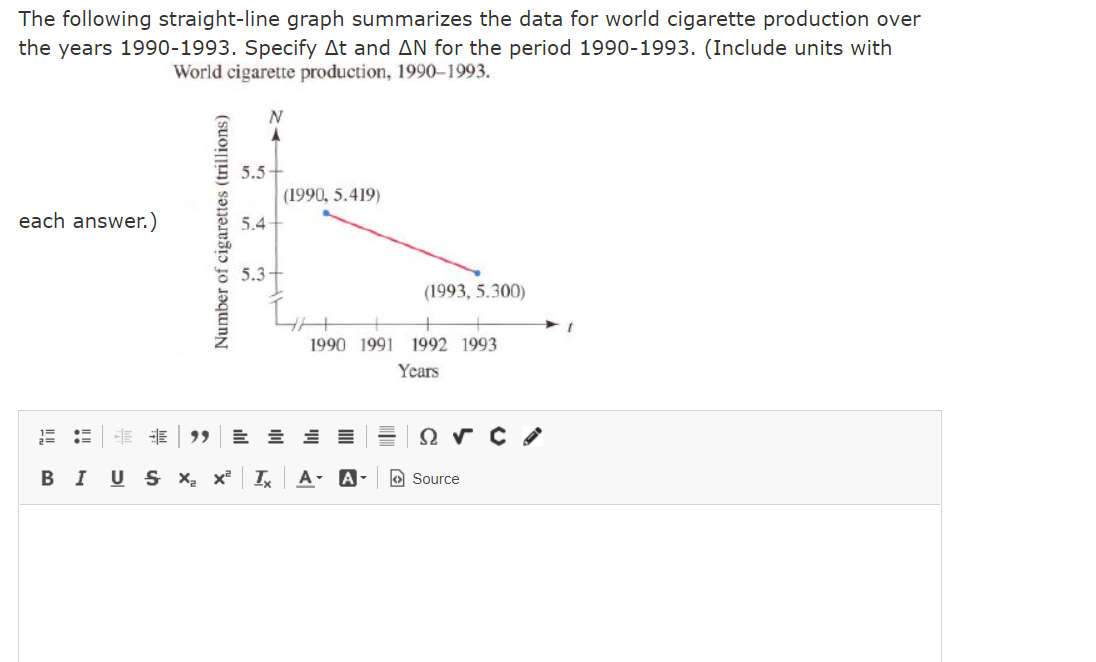


The following straight-line graph summarizes the data for world cigarette production over the years 1990-1993. Specify At and AN for the period 1990-1993. (Include units with World cigarette production, 1990-1993. 2 5.5- (1990, 5.419) each answer.) 5.4 Number of cigarettes (trillions) 5.3+ (1993, 5.300) 1990 1991 1992 1993 Years BI US X X X A- A- > SourcePage 53 Find an equation for the line having the given slope and passing through the given point. 15a. Write your answer in the form y = mx + b. m = -5; through (-2, 1) BIUSXX IX A- A- Source Page 53 m = 1/3; through (-6, -2/3) 15b. BIUS XX IX A- A- > SourcePage 53 find an equation for the line passing through the two given points. Write your answer in 18a. the form y = mx + b. (7, 9) and (-11, 9) BI US X X X A- A- > Source Page 53 (5/4, 2) and (3/4, and 3) 18b. BIUSX X X A- A- > Source
Step by Step Solution
There are 3 Steps involved in it

Get step-by-step solutions from verified subject matter experts