

Question: The following table contains data from a random sample of 12 states and lists expenditures (in billions of dollars) by category spent by states and
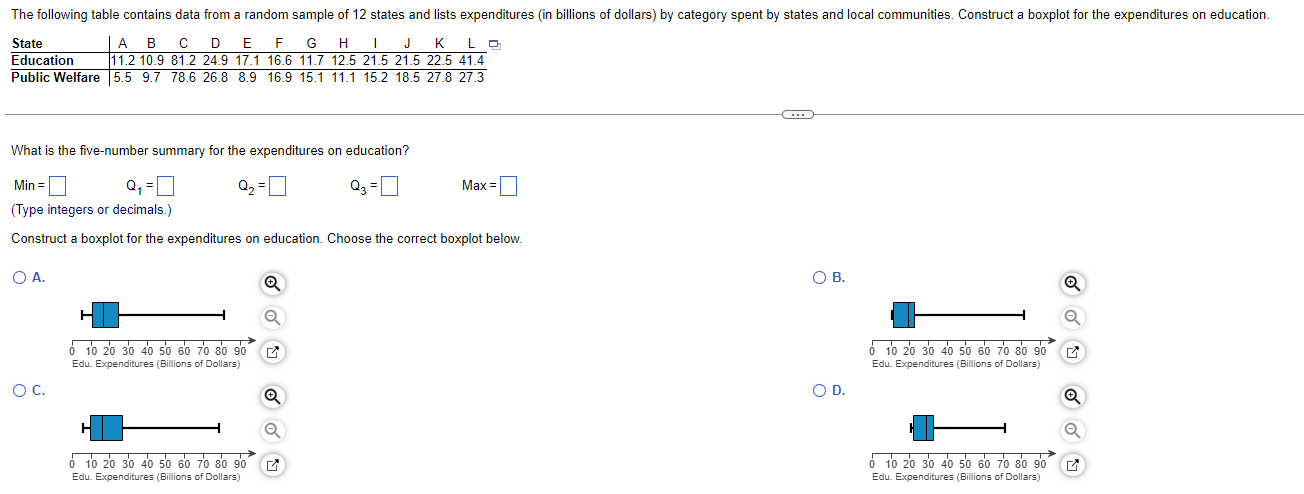
The following table contains data from a random sample of 12 states and lists expenditures (in billions of dollars) by category spent by states and local communities. Construct a boxplot for the expenditures on education. State A B C DE F G H J K Education 11.2 10.9 81.2 24.9 17.1 16.6 11.7 12.5 21.5 21.5 22.5 41.4 Public Welfare 5.5 9.7 78.6 26.8 8.9 16.9 15.1 11.1 15.2 18.5 27.8 27.3 What is the five-number summary for the expenditures on education? Min =_ Q3 = 0 Max = (Type integers or decimals.) Construct a boxplot for the expenditures on education. Choose the correct boxplot below. O A. OB. Q 0 10 20 30 40 50 60 70 80 90 0 10 20 30 40 50 60 70 80 90 Edu. Expenditures (Billions of Dollars) Edu. Expenditures (Billions of Dollars) O C. OD. 0 10 20 30 40 50 60 70 80 90 0 10 20 30 40 50 60 70 80 90 Edu. Expenditures (Billions of Dollars) Edu. Expenditures (Billions of Dollars)
Step by Step Solution
There are 3 Steps involved in it

Get step-by-step solutions from verified subject matter experts