

Question: The following table contains regular logistic regression (Binary) t o examine factors associated with overweight. For logistic regression analysis, normal weight is reference. Overweight and
The following table contains regular logistic regression (Binary) to examine factors associated with overweight.
For logistic regression analysis, normal weight is reference. Overweight and obesity are combined.
Question : Interpret logistic regression results. (for the section highlighted in blue).
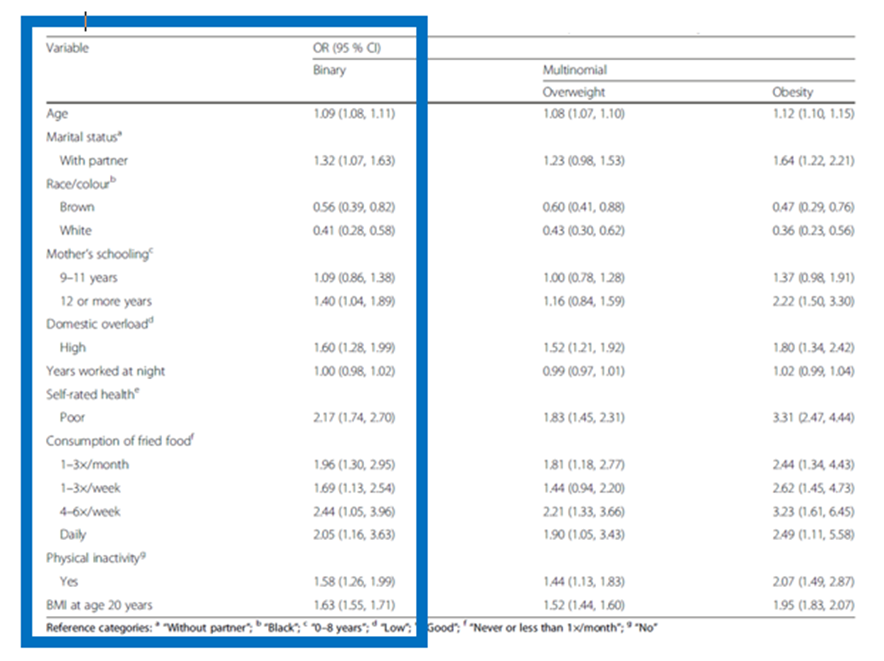
Variable OR (95 % CD) Binary Multinomial Overweight Obesity Age 1.09 (1.08, 1.11) 1.08 (1.07, 1.10) 1.12 (1.10, 1.15) Marital status" With partner 1.32 (1.07, 1.63) 1.23 (0.98, 153) 1.64 (1.22, 2.21) Race/colour Brown 0.56 (0.39, 0.82) 0.60 (0.41, 0.88) 0.47 (0.29, 0.76) White 0.41 (0.28, 0.58) 0.43 (0.30, 0.62) 0.36 (0.23, 0.56) Mother's schooling" 9-11 years 1.09 (0.86, 1.38) 1.00 (0.78, 1.28) 1.37 (0.98, 1.91) 12 or more years 1.40 (1,04, 1.89) 1.16 (0.84, 159) 2.22 (1.50, 3.30) Domestic overload High 1.60 (1.28, 1.99) 1.52 (1.21, 1.92) 1.80 (1.34, 242) Years worked at night 1.00 (0.98, 1.02) 0.99 (0.97, 1.01) 1.02 (0.99 1.04) Self-rated health" Poor 2.17 (1.74, 2.70) 1.83 (1.45, 2.31) 3.31 (2.47, 444) Consumption of fried food 1-3x/month 1.96 (1.30, 2.95) 1.81 (1.18, 2.77) 244 (1.34 4.43) 1-3x/week 1.69 (1.13, 254) 1.44 (0.94, 2.20) 262 (1.45, 4.73) 4-6x/week 244 (1.05, 3.96) 2.21 (1.33, 3.66) 3.23 (1.61, 645) Daily 205 (1.16, 3.63) 1.90 (1,05, 343) 249 (1.11, 5.58) Physical inactivity9 Yes 1.58 (1.26, 1.99) 144 (1.13, 183) 207 (1.49, 2.87) BMI at age 20 years 1.63 (1.55, 1.71) 1.52 (1.44, 1.60) 1.95 (1.83, 2.07) Reference categories: " "Without partner"? ""Black"? " "D-8 years": " Low? Good", ""Never or less than 1x/month": ""No"
Step by Step Solution
There are 3 Steps involved in it

Get step-by-step solutions from verified subject matter experts