

Question: The following table contains time series data for regular gasoline prices in the United States for 36 consecutive months: Month Price ($) Month Price
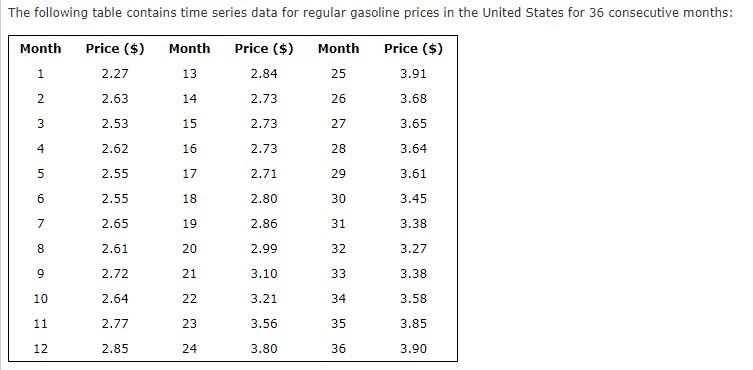
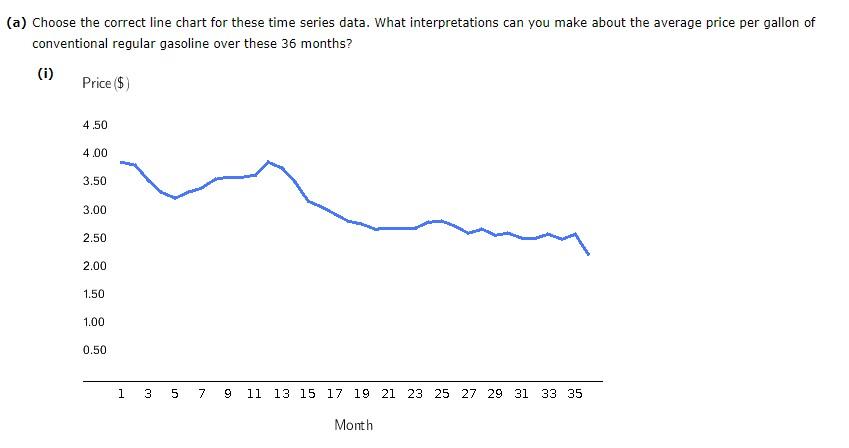
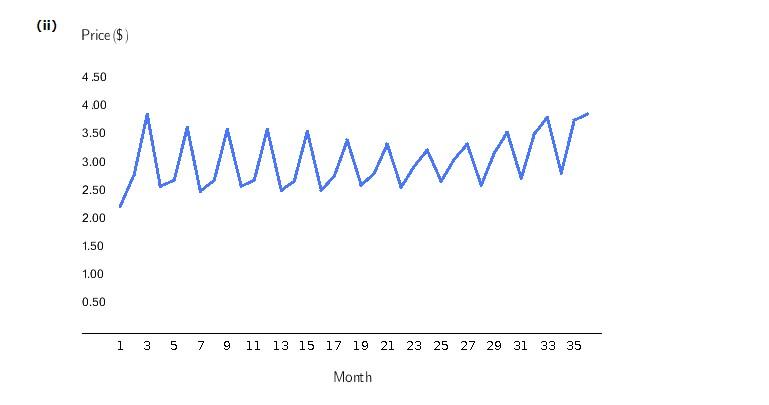
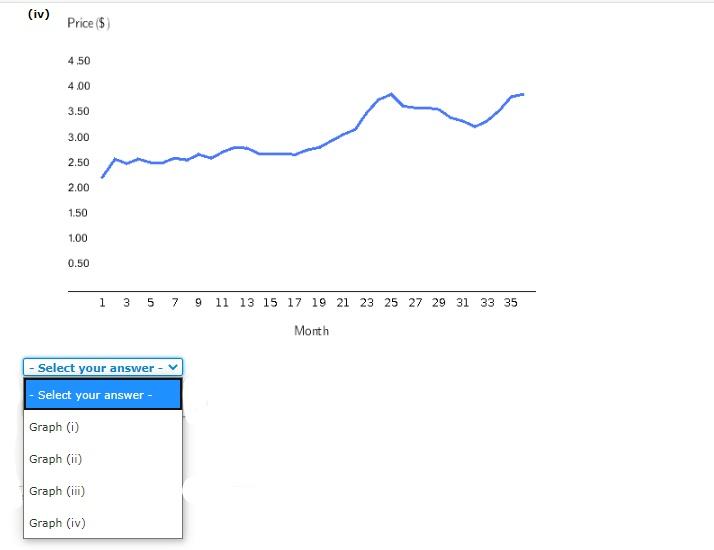
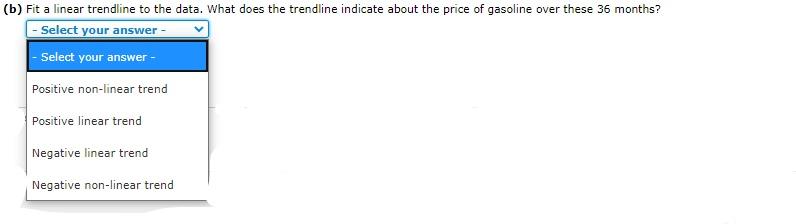
The following table contains time series data for regular gasoline prices in the United States for 36 consecutive months: Month Price ($) Month Price ($) Month Price ($) 2.27 13 2.84 25 3.91 2. 2.63 14 2.73 26 3.68 2.53 15 2.73 27 3.65 4 2.62 16 2.73 28 3.64 2.55 17 2.71 29 3.61 2.55 18 2.80 30 3.45 7 2.65 19 2.86 31 3.38 8 2.61 20 2.99 32 3.27 9. 2.72 21 3.10 33 3.38 10 2.64 22 3.21 34 3.58 11 2.77 23 3.56 35 3.85 12 2.85 24 3.80 36 3.90 (a) Choose the correct line chart for these time series data. What interpretations can you make about the average price per gallon of conventional regular gasoline over these 36 months? (i) Price ($) 4.50 4.00 3.50 3.00 2.50 2.00 1.50 1.00 0.50 1 3 5 7 9 11 13 15 17 19 21 23 25 27 29 31 33 35 Month (ii) Price ($) 4.50 4.00 3.50 ww 3.00 2.50 2.00 1.50 1.00 0.50 1 3 5 7 9 11 13 15 17 19 21 23 25 27 29 31 33 35 Month (iii) Price ($) 4.50 4.00 3.50 3.00 2.50 2.00 1.50 1.00 0.50 1 7 11 13 15 17 19 21 23 25 27 29 31 33 35 Month 3, (iv) Price ($) 4,50 4.00 3.50 3.00 2.50 2.00 1.50 1.00 0.50 1 3 5 7 9 11 13 15 17 19 21 23 25 27 29 31 33 35 Month - Select your answer Select your answer - Graph (i) Graph (ii) Graph (iii) Graph (iv) (b) Fit a linear trendline to the data. What does the trendline indicate about the price of gasoline over these 36 months? - Select your answer - - Select your answer - Positive non-linear trend Positive linear trend Negative linear trend Negative non-linear trend The following table contains time series data for regular gasoline prices in the United States for 36 consecutive months: Month Price ($) Month Price ($) Month Price ($) 2.27 13 2.84 25 3.91 2. 2.63 14 2.73 26 3.68 2.53 15 2.73 27 3.65 4 2.62 16 2.73 28 3.64 2.55 17 2.71 29 3.61 2.55 18 2.80 30 3.45 7 2.65 19 2.86 31 3.38 8 2.61 20 2.99 32 3.27 9. 2.72 21 3.10 33 3.38 10 2.64 22 3.21 34 3.58 11 2.77 23 3.56 35 3.85 12 2.85 24 3.80 36 3.90 (a) Choose the correct line chart for these time series data. What interpretations can you make about the average price per gallon of conventional regular gasoline over these 36 months? (i) Price ($) 4.50 4.00 3.50 3.00 2.50 2.00 1.50 1.00 0.50 1 3 5 7 9 11 13 15 17 19 21 23 25 27 29 31 33 35 Month (ii) Price ($) 4.50 4.00 3.50 ww 3.00 2.50 2.00 1.50 1.00 0.50 1 3 5 7 9 11 13 15 17 19 21 23 25 27 29 31 33 35 Month (iii) Price ($) 4.50 4.00 3.50 3.00 2.50 2.00 1.50 1.00 0.50 1 7 11 13 15 17 19 21 23 25 27 29 31 33 35 Month 3, (iv) Price ($) 4,50 4.00 3.50 3.00 2.50 2.00 1.50 1.00 0.50 1 3 5 7 9 11 13 15 17 19 21 23 25 27 29 31 33 35 Month - Select your answer Select your answer - Graph (i) Graph (ii) Graph (iii) Graph (iv) (b) Fit a linear trendline to the data. What does the trendline indicate about the price of gasoline over these 36 months? - Select your answer - - Select your answer - Positive non-linear trend Positive linear trend Negative linear trend Negative non-linear trend The following table contains time series data for regular gasoline prices in the United States for 36 consecutive months: Month Price ($) Month Price ($) Month Price ($) 2.27 13 2.84 25 3.91 2. 2.63 14 2.73 26 3.68 2.53 15 2.73 27 3.65 4 2.62 16 2.73 28 3.64 2.55 17 2.71 29 3.61 2.55 18 2.80 30 3.45 7 2.65 19 2.86 31 3.38 8 2.61 20 2.99 32 3.27 9. 2.72 21 3.10 33 3.38 10 2.64 22 3.21 34 3.58 11 2.77 23 3.56 35 3.85 12 2.85 24 3.80 36 3.90 (a) Choose the correct line chart for these time series data. What interpretations can you make about the average price per gallon of conventional regular gasoline over these 36 months? (i) Price ($) 4.50 4.00 3.50 3.00 2.50 2.00 1.50 1.00 0.50 1 3 5 7 9 11 13 15 17 19 21 23 25 27 29 31 33 35 Month (ii) Price ($) 4.50 4.00 3.50 ww 3.00 2.50 2.00 1.50 1.00 0.50 1 3 5 7 9 11 13 15 17 19 21 23 25 27 29 31 33 35 Month (iii) Price ($) 4.50 4.00 3.50 3.00 2.50 2.00 1.50 1.00 0.50 1 7 11 13 15 17 19 21 23 25 27 29 31 33 35 Month 3, (iv) Price ($) 4,50 4.00 3.50 3.00 2.50 2.00 1.50 1.00 0.50 1 3 5 7 9 11 13 15 17 19 21 23 25 27 29 31 33 35 Month - Select your answer Select your answer - Graph (i) Graph (ii) Graph (iii) Graph (iv) (b) Fit a linear trendline to the data. What does the trendline indicate about the price of gasoline over these 36 months? - Select your answer - - Select your answer - Positive non-linear trend Positive linear trend Negative linear trend Negative non-linear trend The following table contains time series data for regular gasoline prices in the United States for 36 consecutive months: Month Price ($) Month Price ($) Month Price ($) 2.27 13 2.84 25 3.91 2. 2.63 14 2.73 26 3.68 2.53 15 2.73 27 3.65 4 2.62 16 2.73 28 3.64 2.55 17 2.71 29 3.61 2.55 18 2.80 30 3.45 7 2.65 19 2.86 31 3.38 8 2.61 20 2.99 32 3.27 9. 2.72 21 3.10 33 3.38 10 2.64 22 3.21 34 3.58 11 2.77 23 3.56 35 3.85 12 2.85 24 3.80 36 3.90 (a) Choose the correct line chart for these time series data. What interpretations can you make about the average price per gallon of conventional regular gasoline over these 36 months? (i) Price ($) 4.50 4.00 3.50 3.00 2.50 2.00 1.50 1.00 0.50 1 3 5 7 9 11 13 15 17 19 21 23 25 27 29 31 33 35 Month (ii) Price ($) 4.50 4.00 3.50 ww 3.00 2.50 2.00 1.50 1.00 0.50 1 3 5 7 9 11 13 15 17 19 21 23 25 27 29 31 33 35 Month (iii) Price ($) 4.50 4.00 3.50 3.00 2.50 2.00 1.50 1.00 0.50 1 7 11 13 15 17 19 21 23 25 27 29 31 33 35 Month 3, (iv) Price ($) 4,50 4.00 3.50 3.00 2.50 2.00 1.50 1.00 0.50 1 3 5 7 9 11 13 15 17 19 21 23 25 27 29 31 33 35 Month - Select your answer Select your answer - Graph (i) Graph (ii) Graph (iii) Graph (iv) (b) Fit a linear trendline to the data. What does the trendline indicate about the price of gasoline over these 36 months? - Select your answer - - Select your answer - Positive non-linear trend Positive linear trend Negative linear trend Negative non-linear trend
Step by Step Solution
3.48 Rating (164 Votes )
There are 3 Steps involved in it
Solution a The answer is Graph iv To construct a line chart in Excel follow the below steps 1 Choose ... View full answer

Get step-by-step solutions from verified subject matter experts